
Blog · 30
Notes on analytics, dashboards and data
I write about what I do every day: tracking, pipelines, dashboards and the metrics owners actually make decisions with. Formulas, SQL and checklists, no fluff.
Pillar guide
- Data pipelines for small businesses: ETL without the enterprise overhead
- Power BI vs Looker Studio vs Metabase (and Tableau): which to choose
- Unit economics: formulas, a worked example and a dashboard
- Marketing attribution models: how to measure channels honestly
- GA4 BigQuery export: a practical guide for business owners
- Business dashboards: how to build one people actually open
Sections
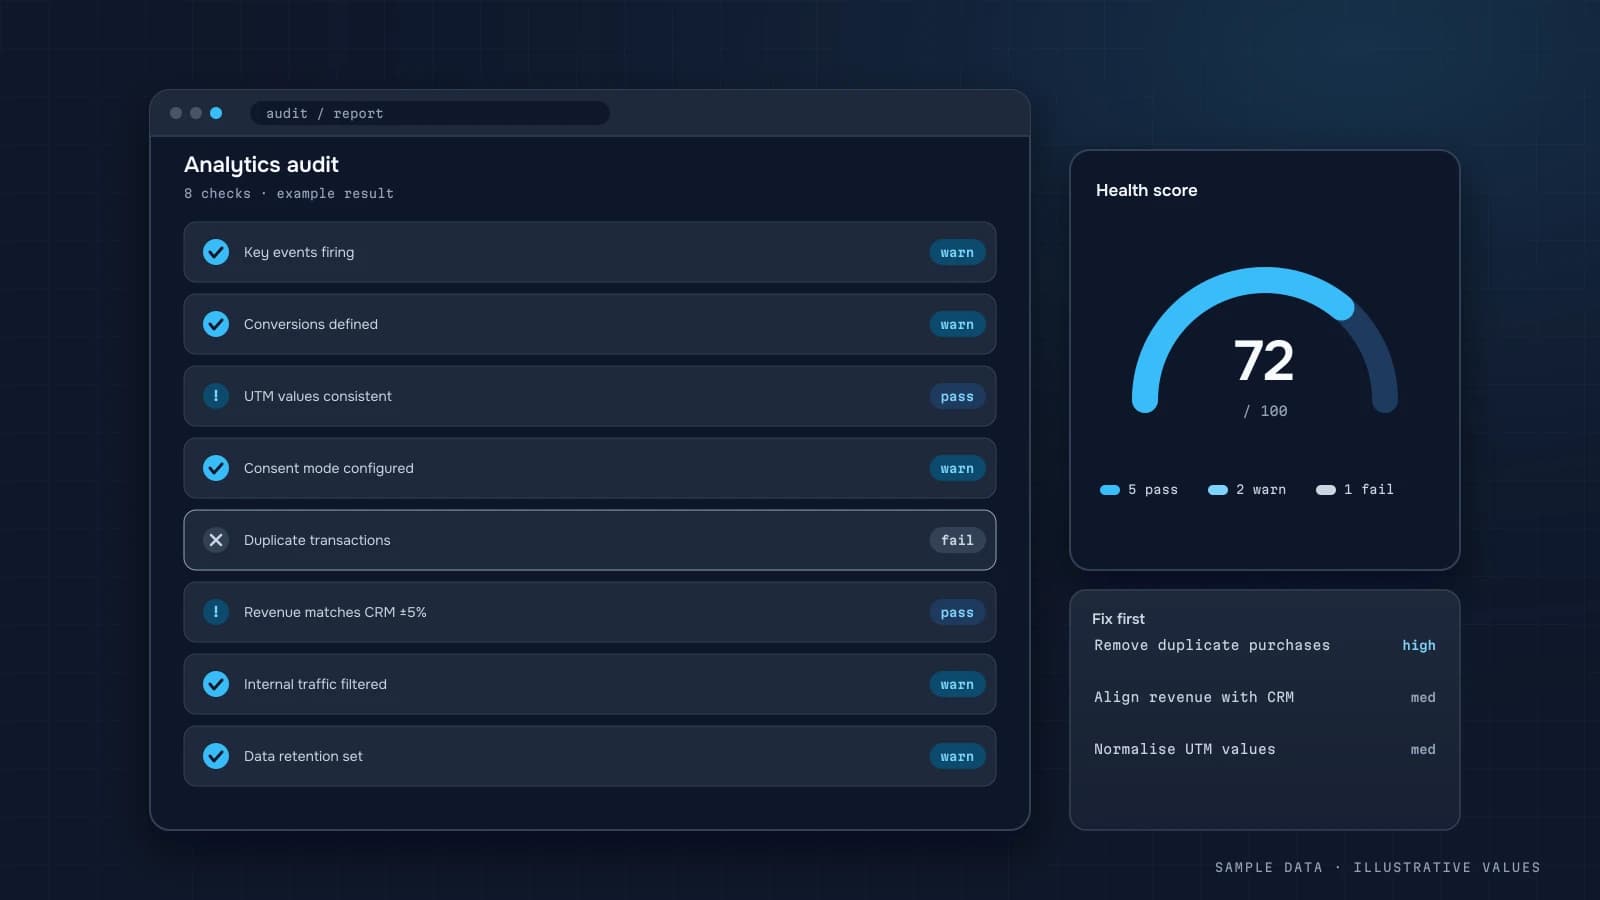
Analytics audit: a 40-point checklist
A step-by-step audit of business analytics covering GA4, tags, UTMs, conversions, consent, CRM, ads, the warehouse and dashboards, with a 40-point checklist, fix priorities and a report template.
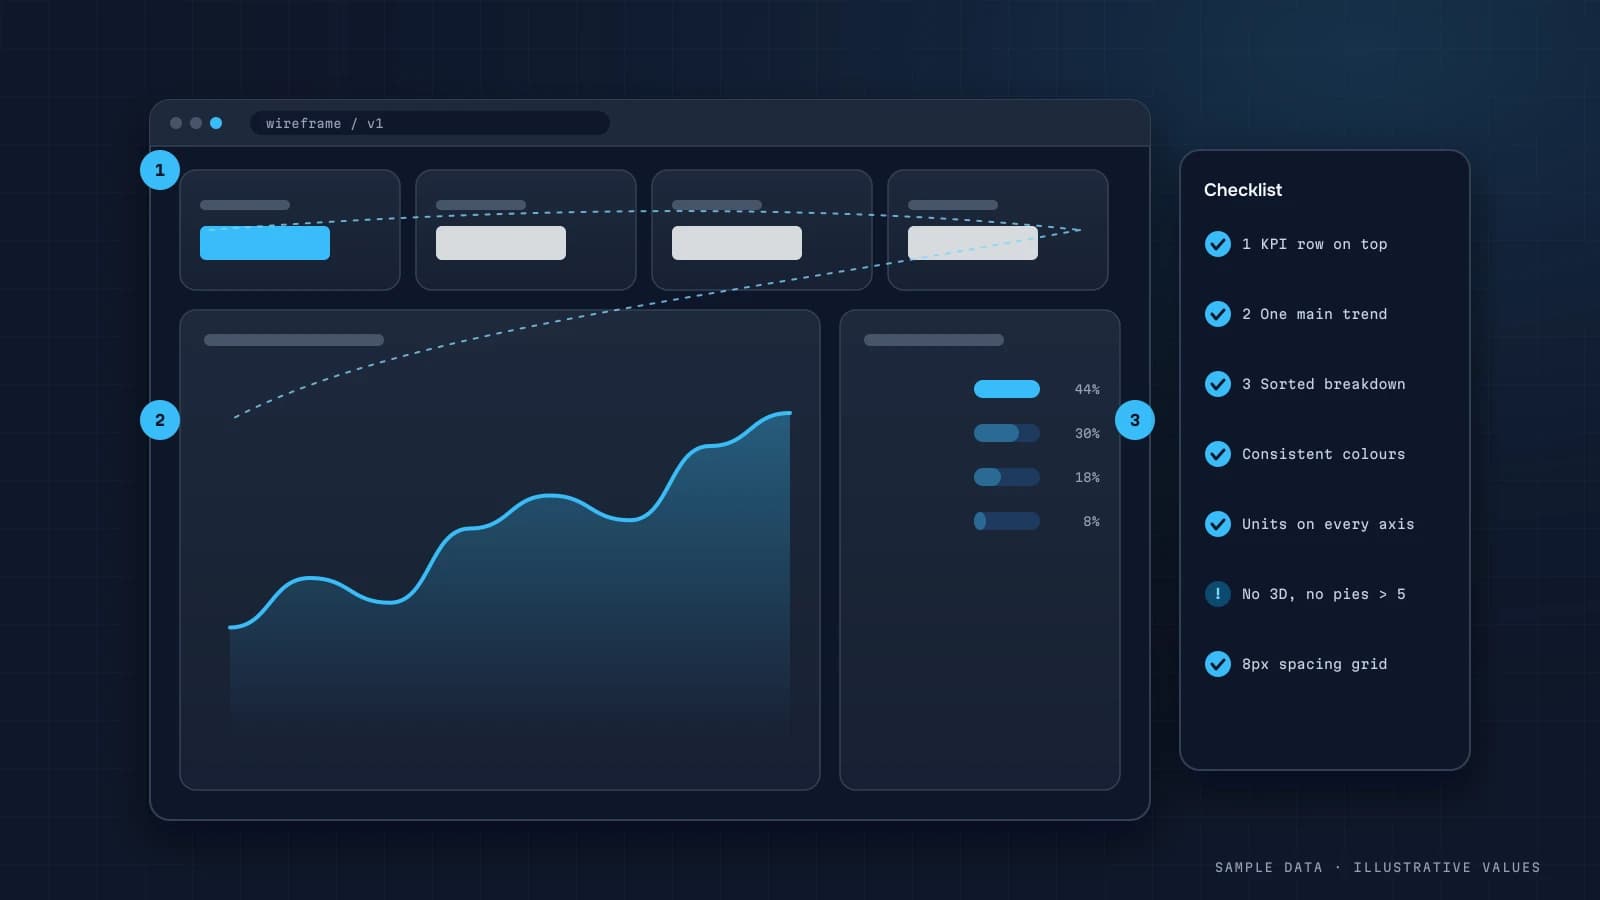
Dashboard design: 12 rules so people actually use it
Practical rules for business dashboard design (hierarchy, chart choice, comparisons, colour, accessibility, mobile), with typical mistakes and a pre-launch checklist.
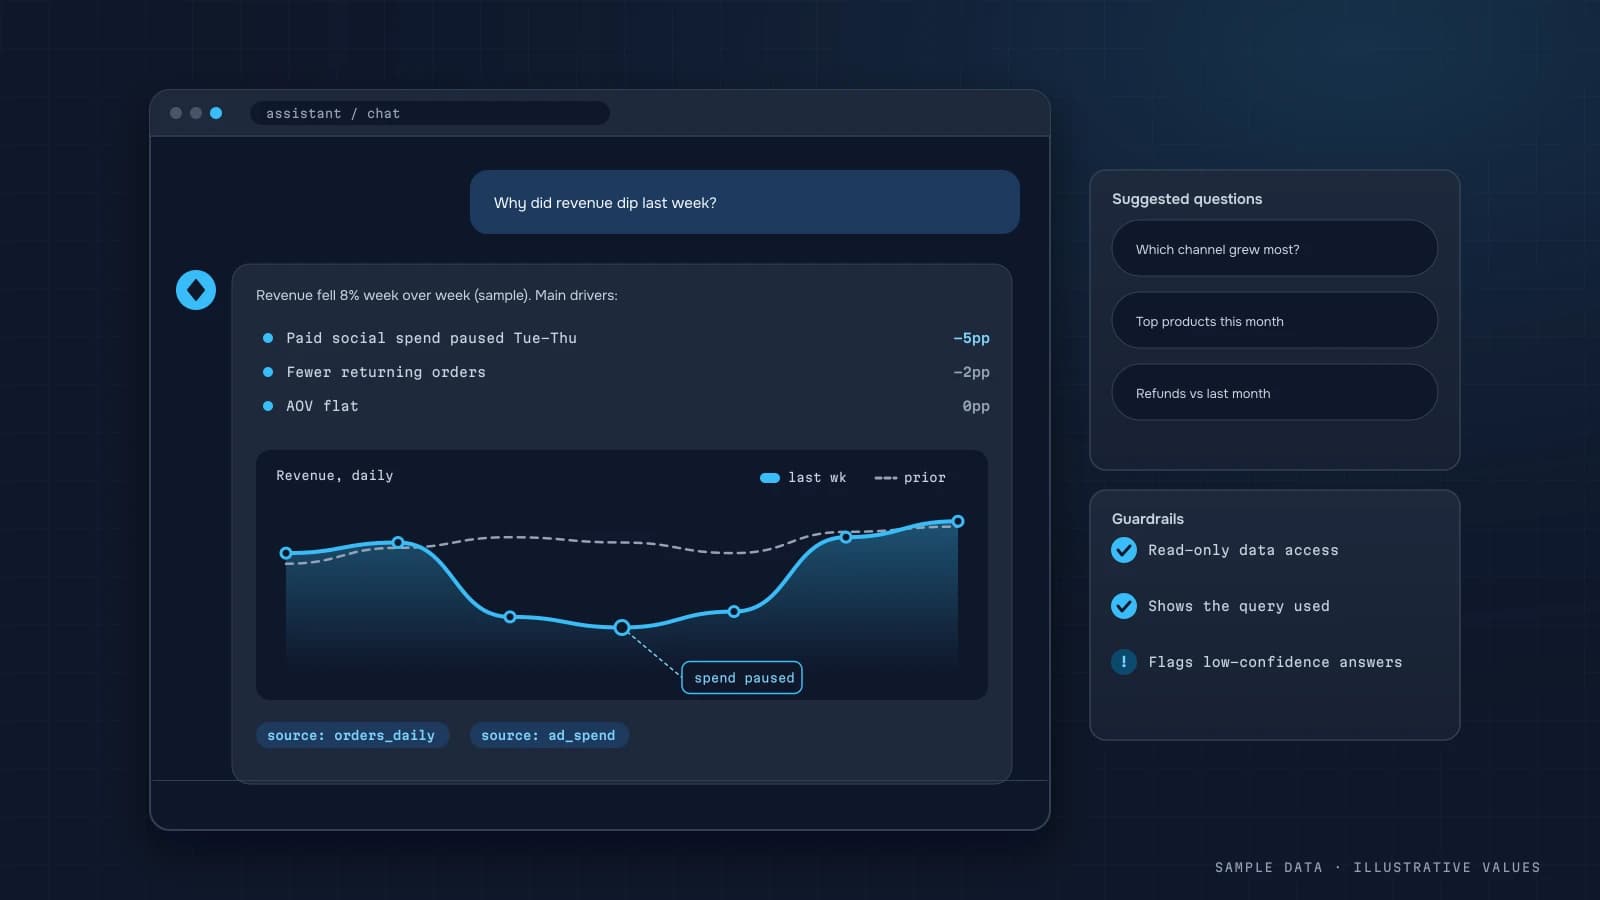
An AI assistant for business data: asking your dashboard in plain words
How an AI assistant over your data works (text-to-SQL, a semantic layer, access limits), where it helps, where it gets things wrong, and how to roll it out safely without leaking data.
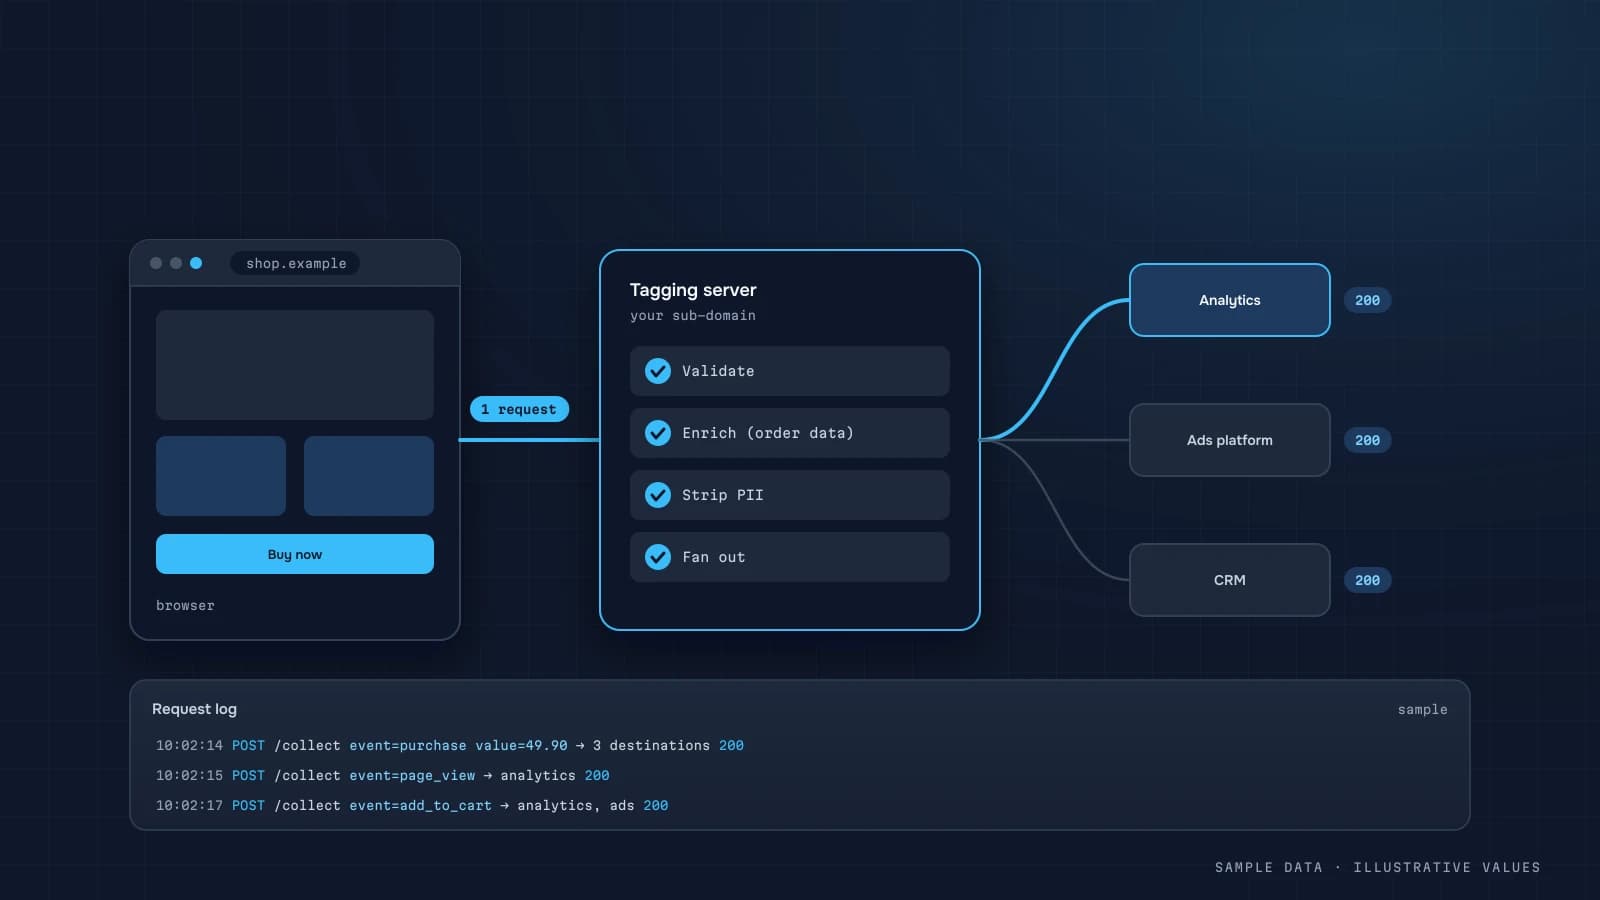
Server-side tracking and the GA4 Measurement Protocol: when you need it
What server-side tracking is, how server-side GTM differs from the GA4 Measurement Protocol, which events belong on the backend (payments, refunds, offline sales), and how to respect consent and avoid duplicates.
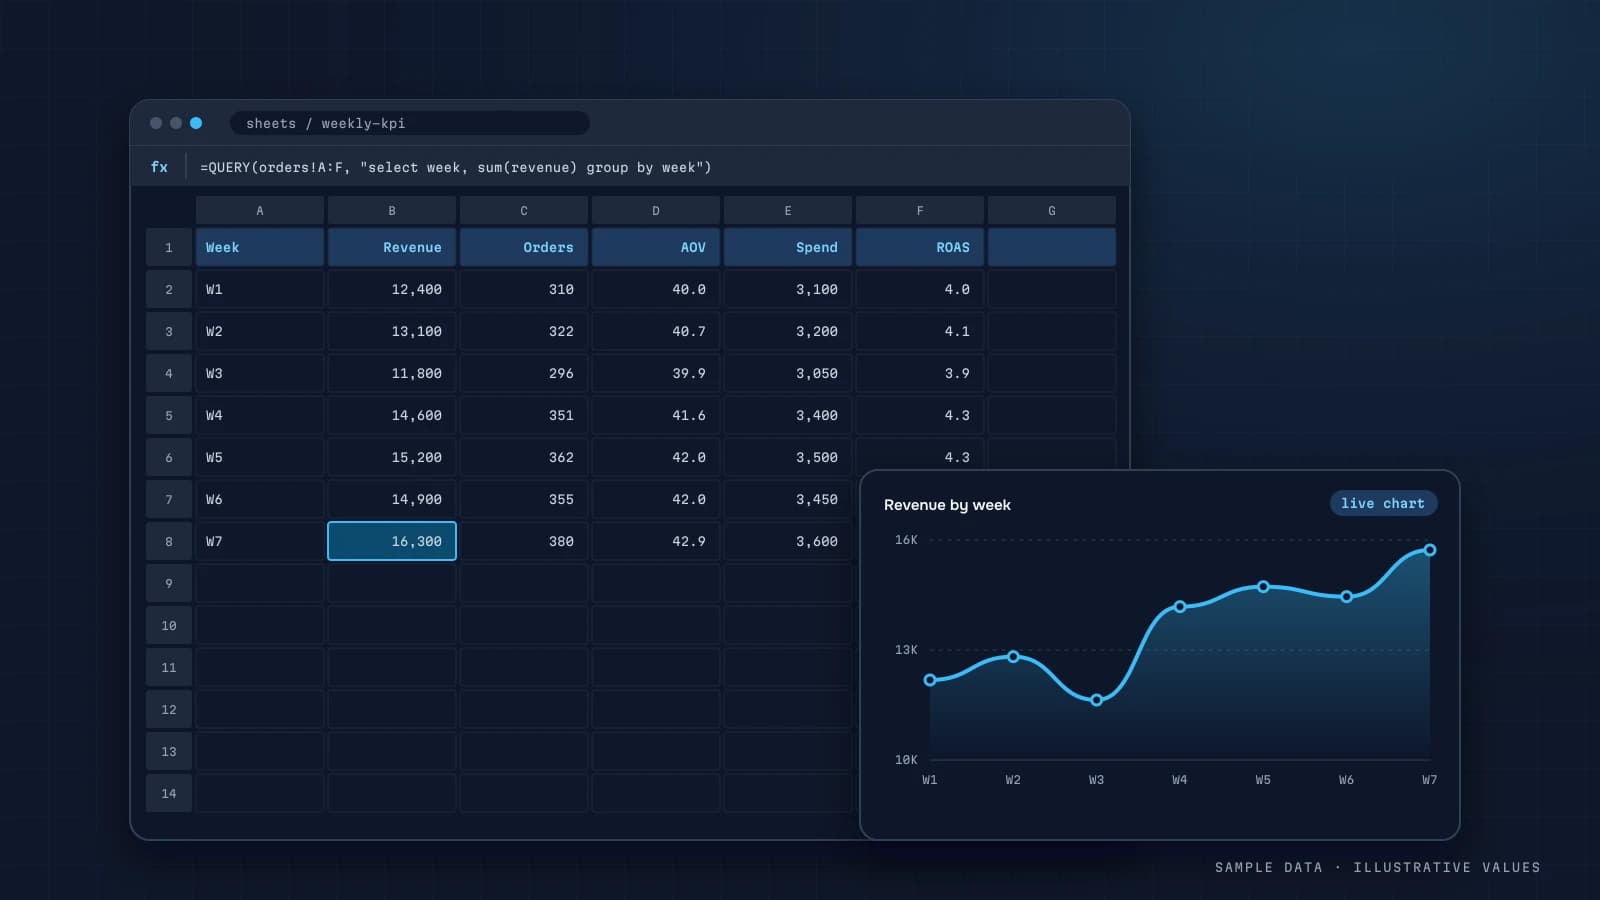
Google Sheets dashboards: when they're enough and where they break
How to build a working dashboard in Google Sheets (sheet structure, QUERY, IMPORTRANGE, pivots, sparklines) and the signs that it's time to move to a warehouse and a proper dashboard.
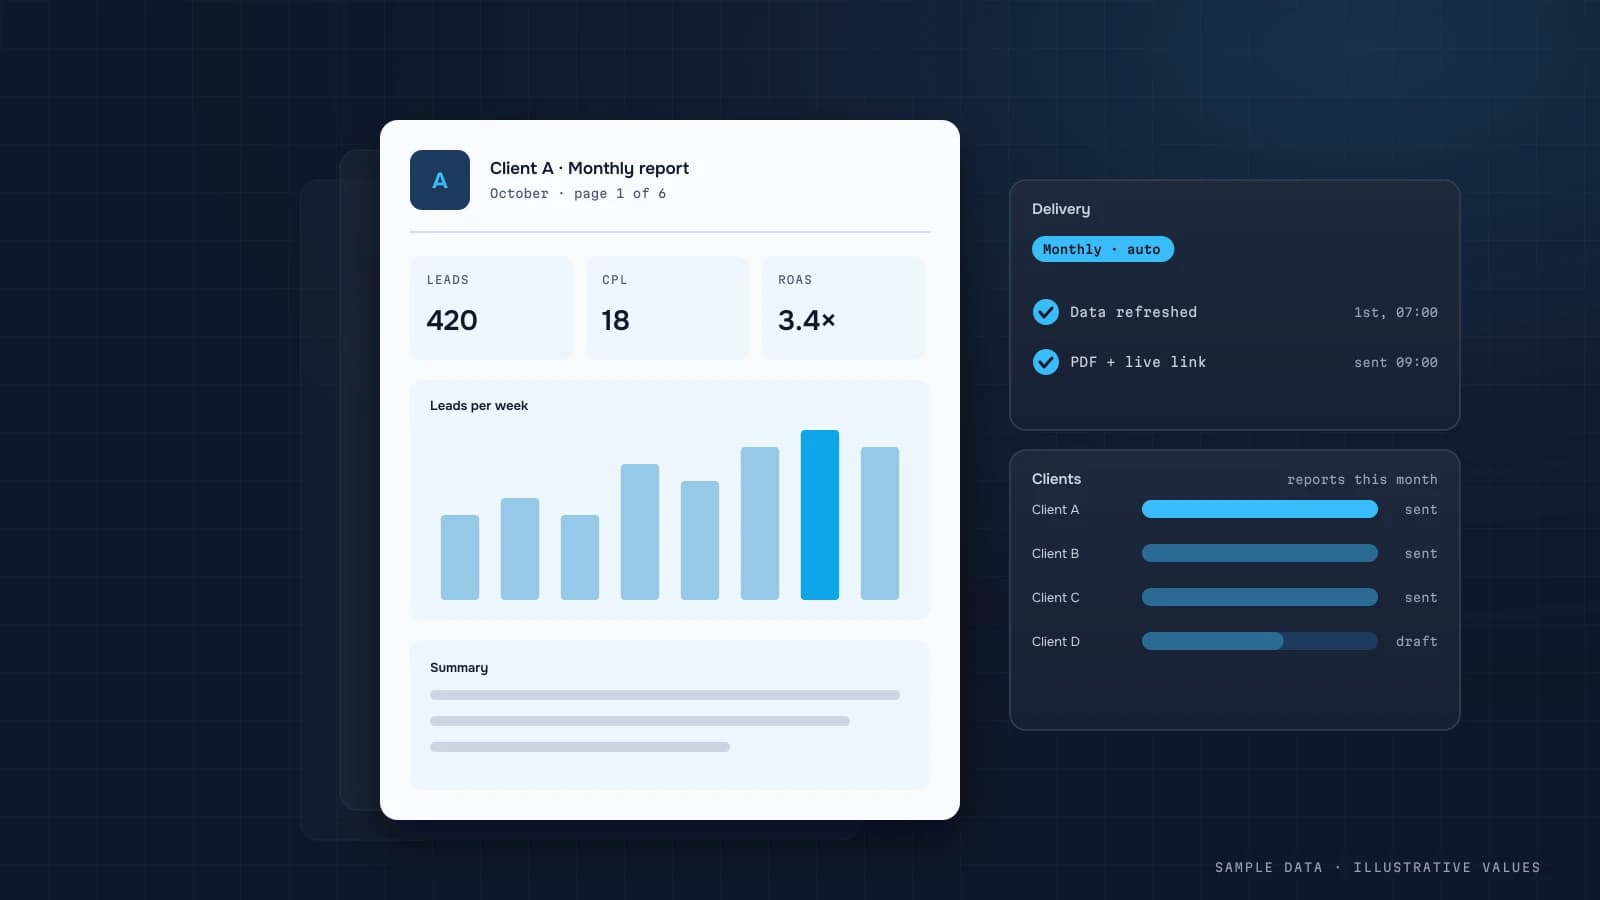
Agency client reporting: an automated dashboard instead of screenshots
How a marketing agency can automate client reporting with a clear report structure, budget pacing, plan vs actual, explained changes, a white-label portal and chat reports, so account managers stop losing days to screenshots.
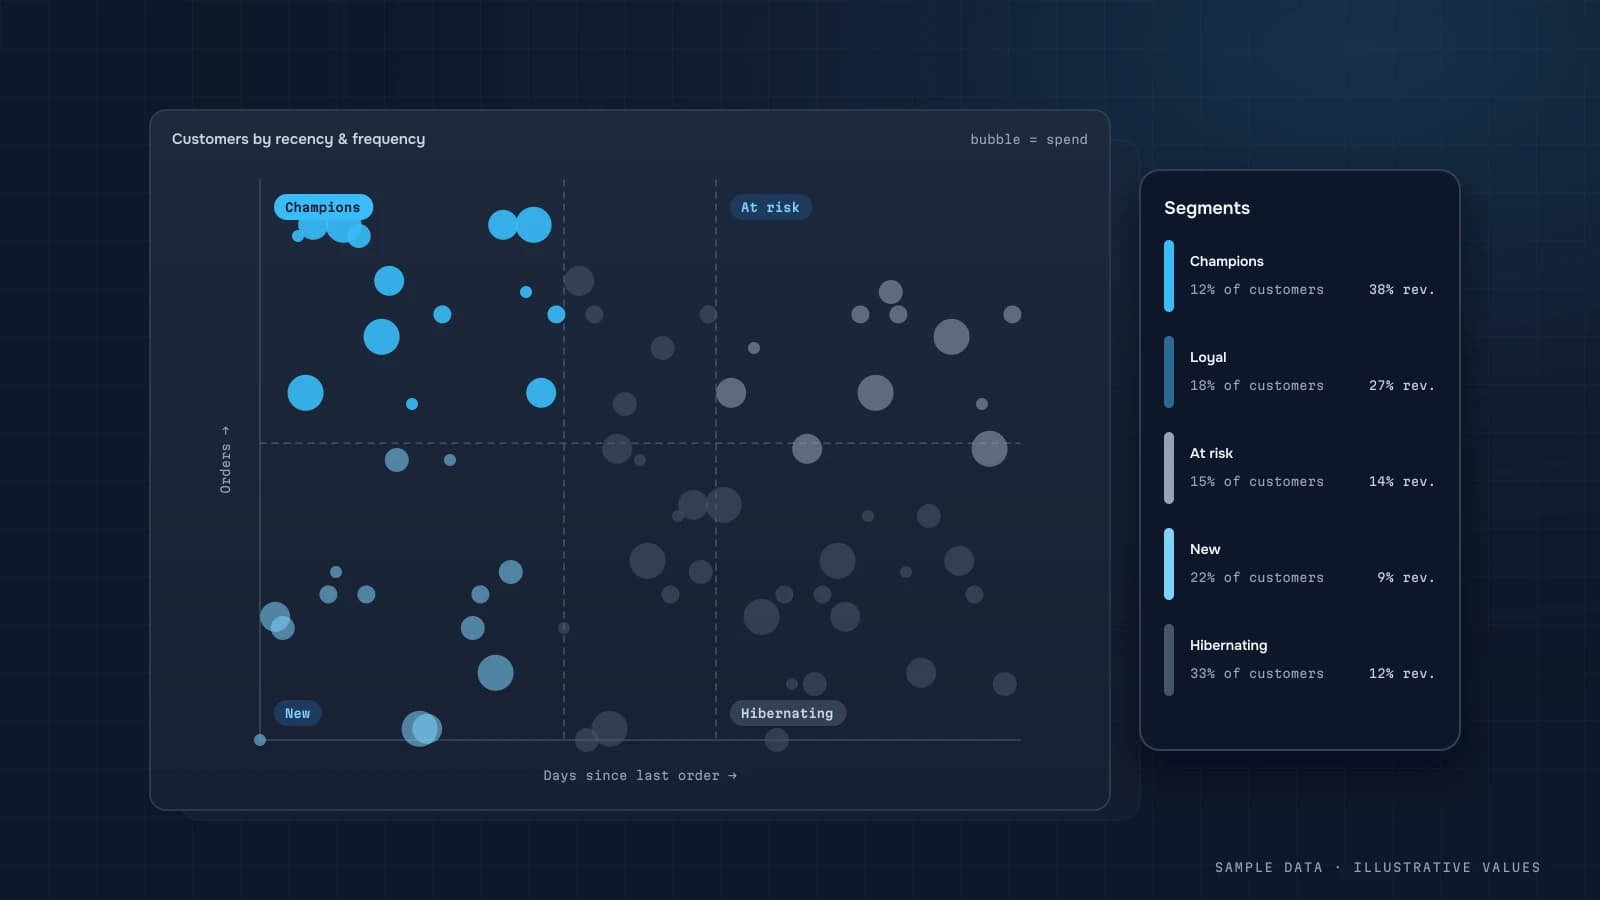
RFM segmentation: segments, SQL and what to do with each
How to run RFM segmentation on a store's or service business's customer base using recency, frequency and monetary value. Covers scoring rules, a SQL query, ready-made segments (champions, at risk, hibernating) and the campaign to run for each.
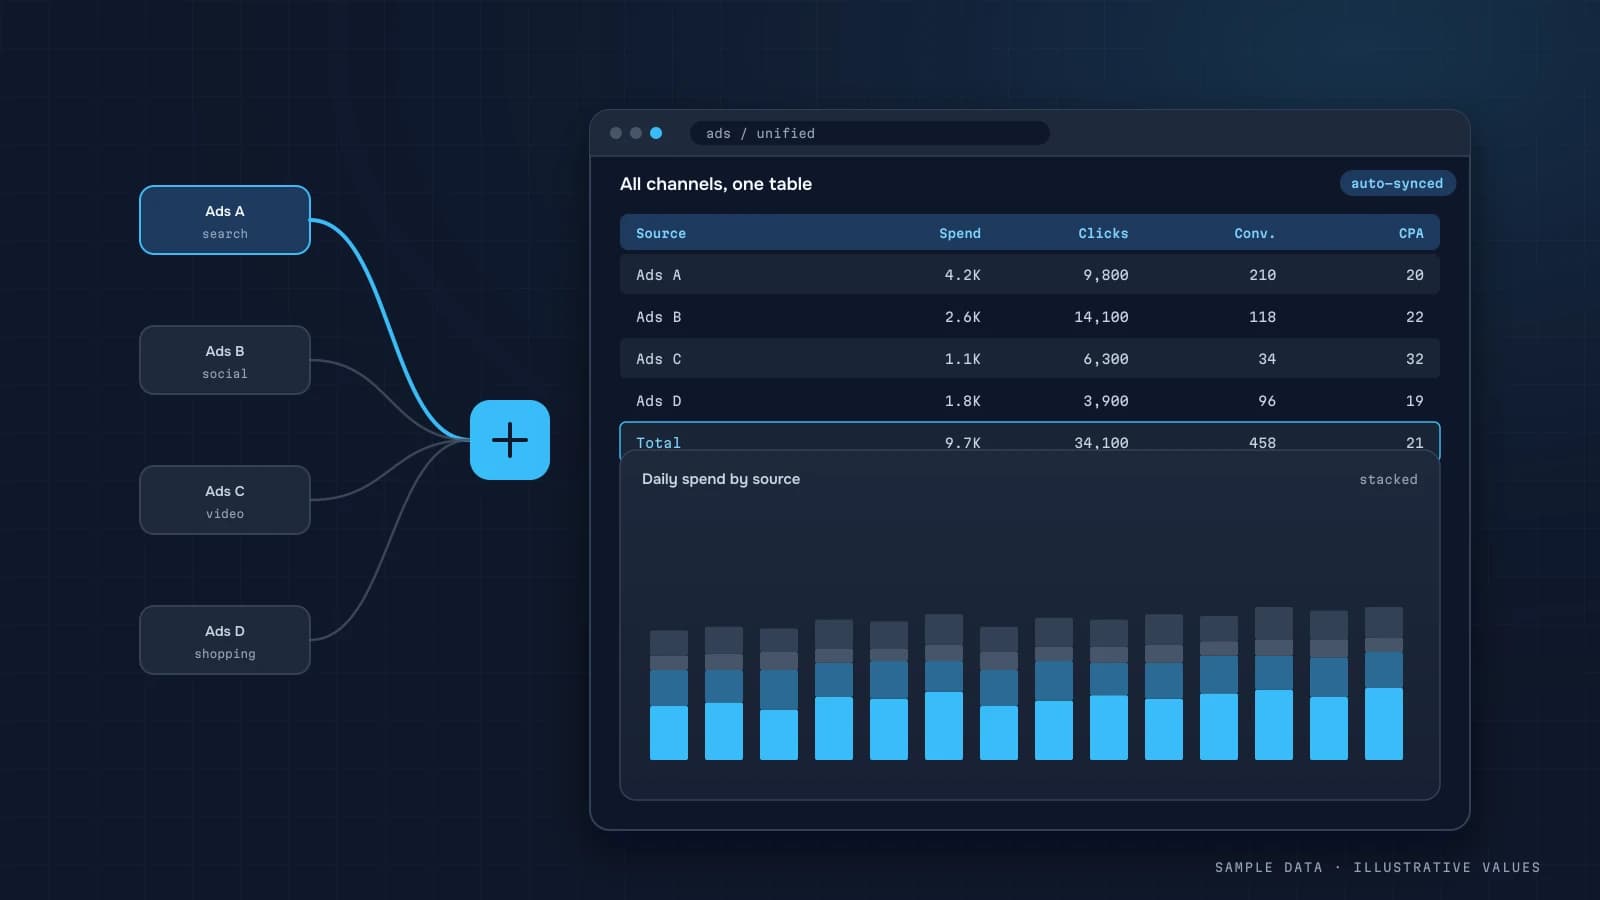
Google Ads, Meta and TikTok in one dashboard: cross-channel ad reporting
How to combine spend and results from Google Ads, Meta Ads and TikTok Ads into one report, covering a shared schema, currencies, time zones and retroactive conversion updates, then add backend orders so you see real ROAS.
Consent mode v2 and your analytics: what changes and how to cope
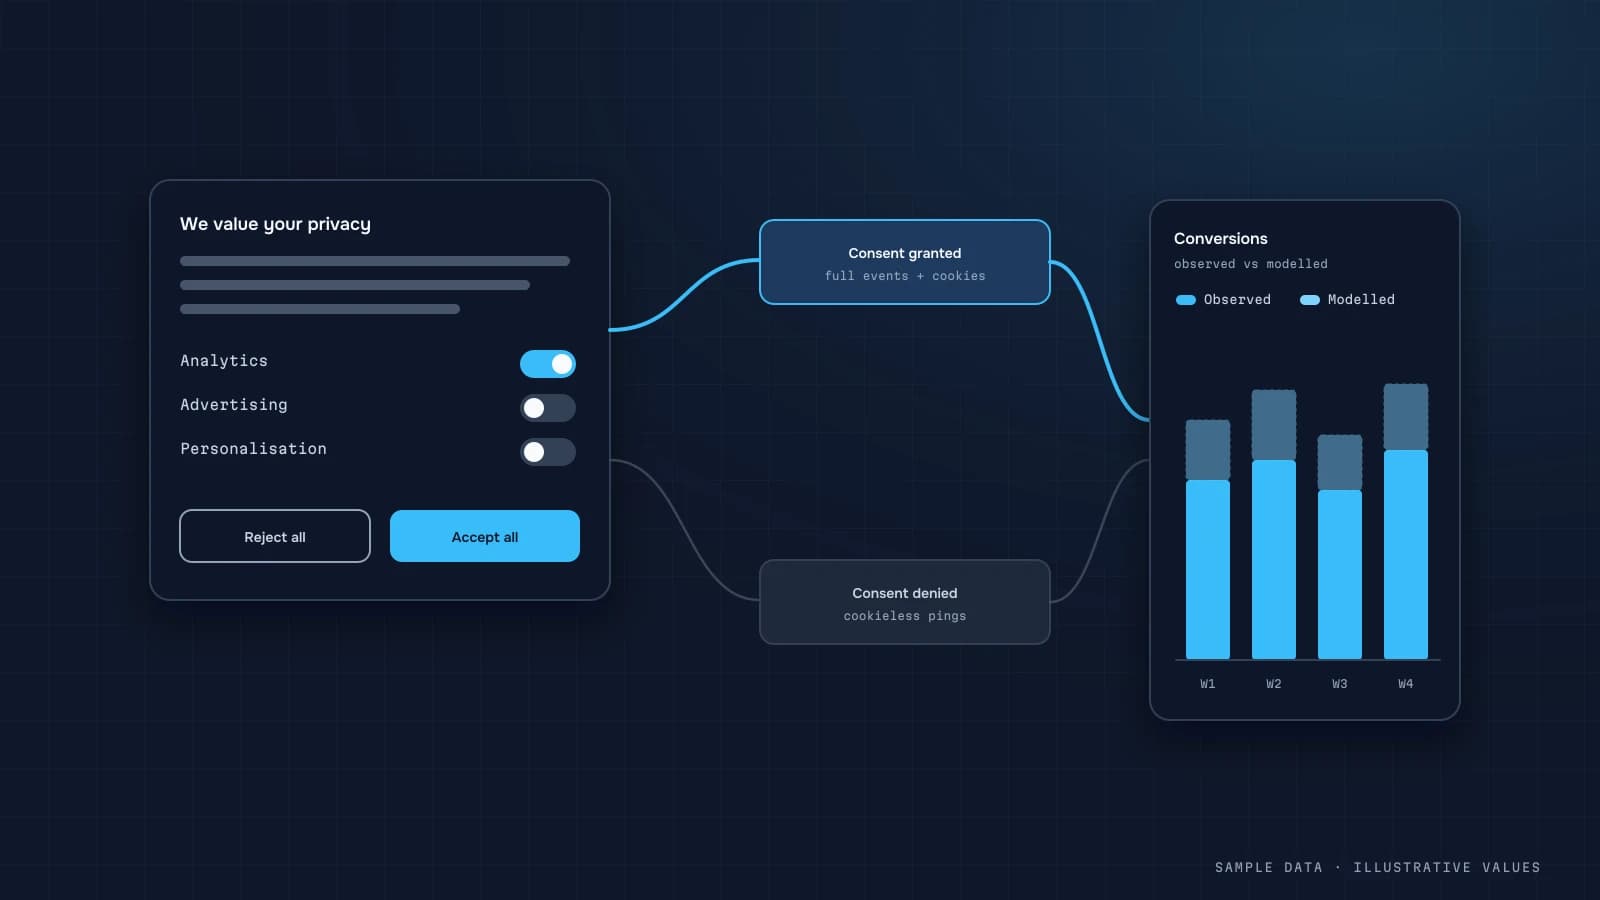
What consent mode v2 is, how basic and advanced modes differ, how declined cookies change your GA4 and ad platform data, and how to set up the banner so you stay compliant without losing your analytics.
Service business analytics: bookings, utilisation and no-shows
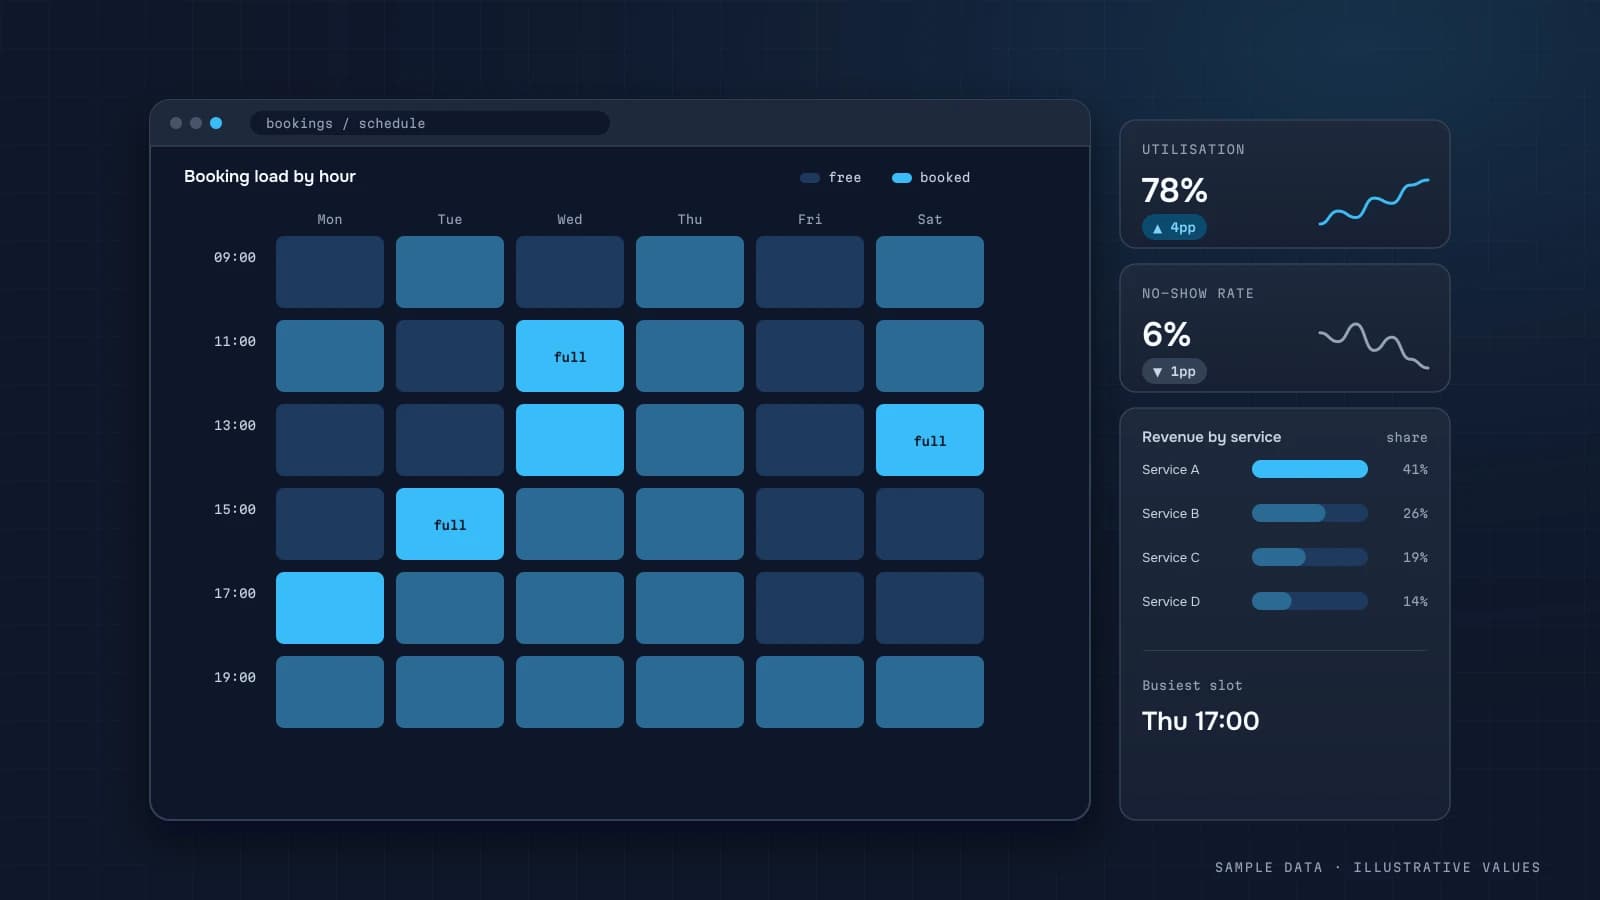
The metrics salons, studios, schools, repair shops and local services need (bookings, schedule utilisation, no-shows, cost per booking, revenue per staff member, repeat visits) and how to pull them from booking tools, your CRM and ads.
Static micro-dashboards on GitHub Pages or Vercel: fast reports without BI
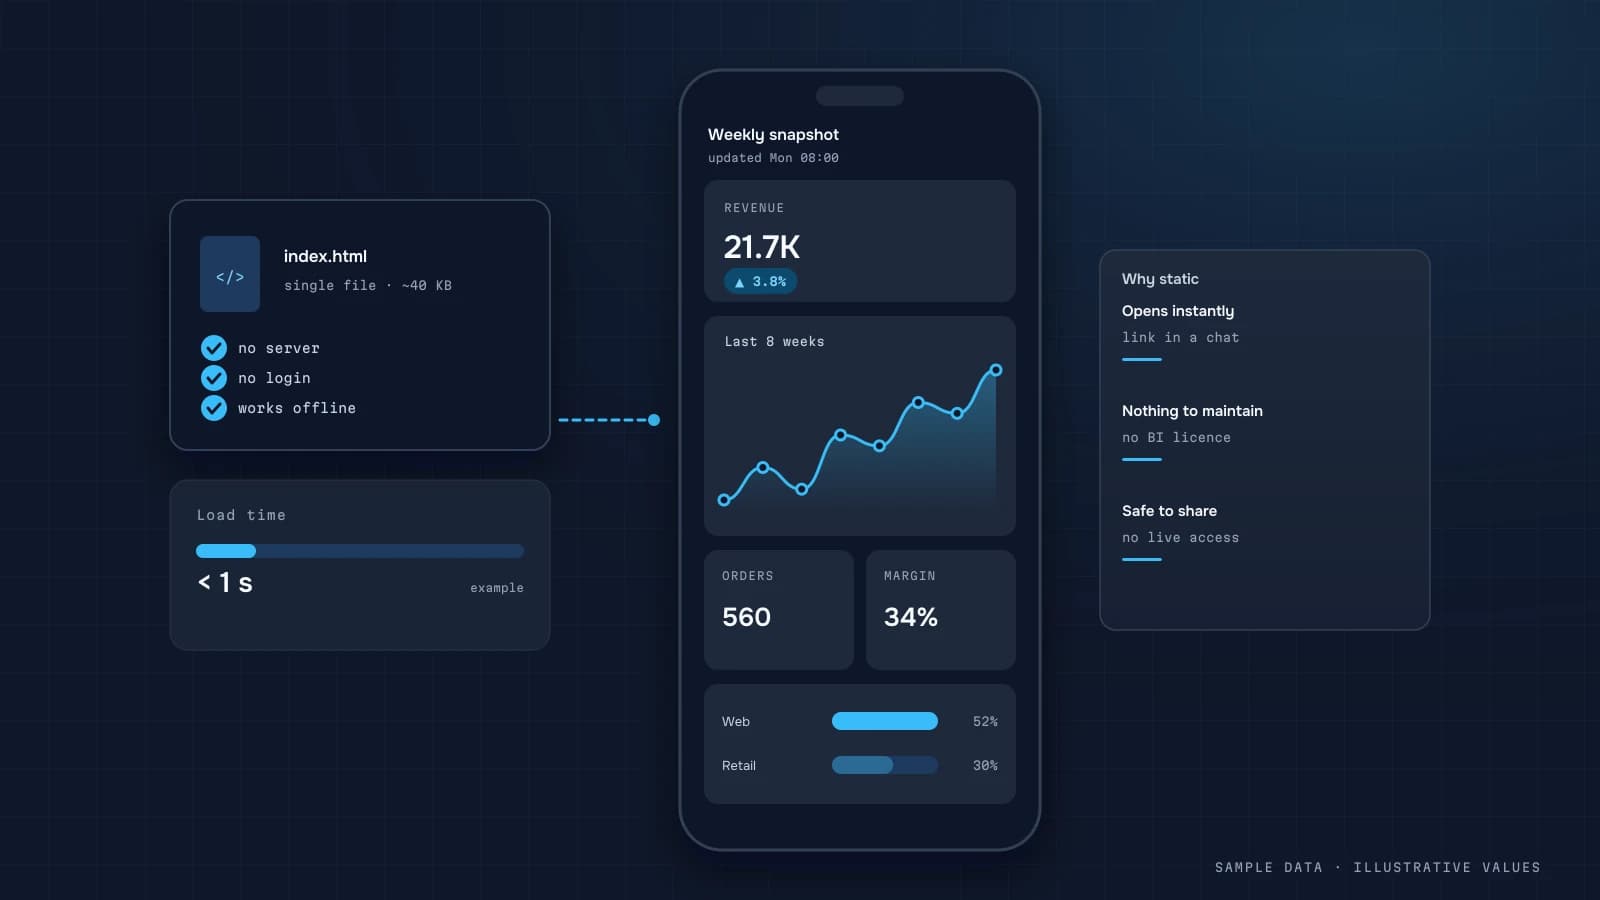
What a static micro-dashboard is, when it's enough instead of BI, how to build one from CSVs, Google Sheets or exports in a few days, and how to publish it on GitHub Pages or Vercel with access protection.
Contribution margin for ecommerce: CM1, CM2, CM3 with an example
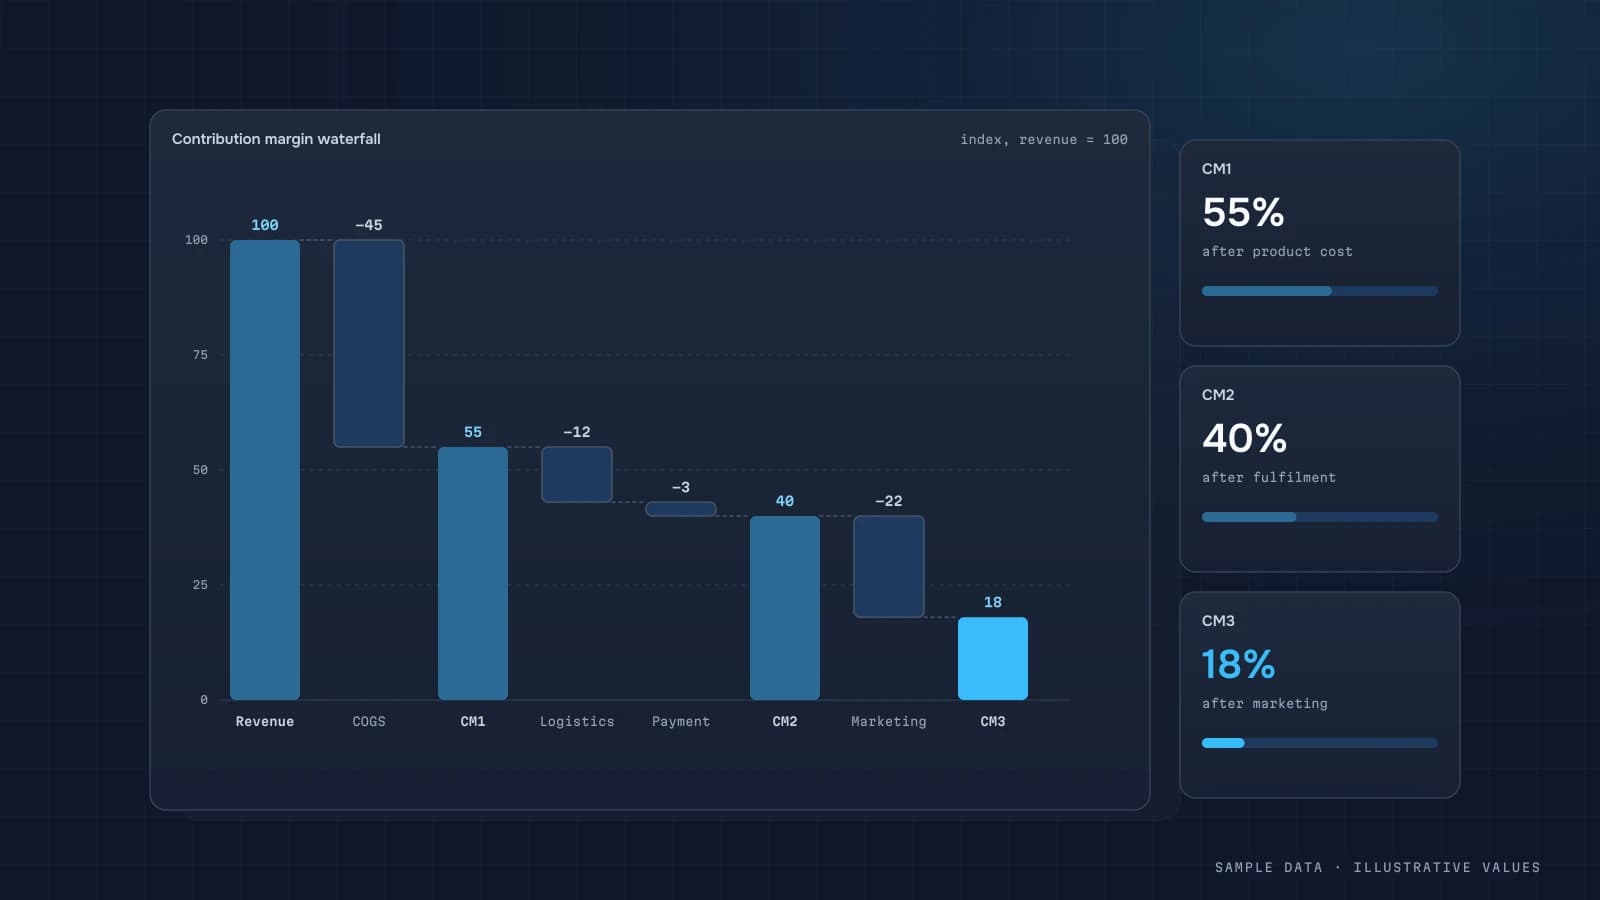
How to calculate an online store's contribution margin in three levels (COGS, shipping, returns, payment fees, ad spend) and how to show a revenue-to-profit waterfall on your dashboard.
AppsFlyer attribution: OneLink, SKAN and a revenue dashboard
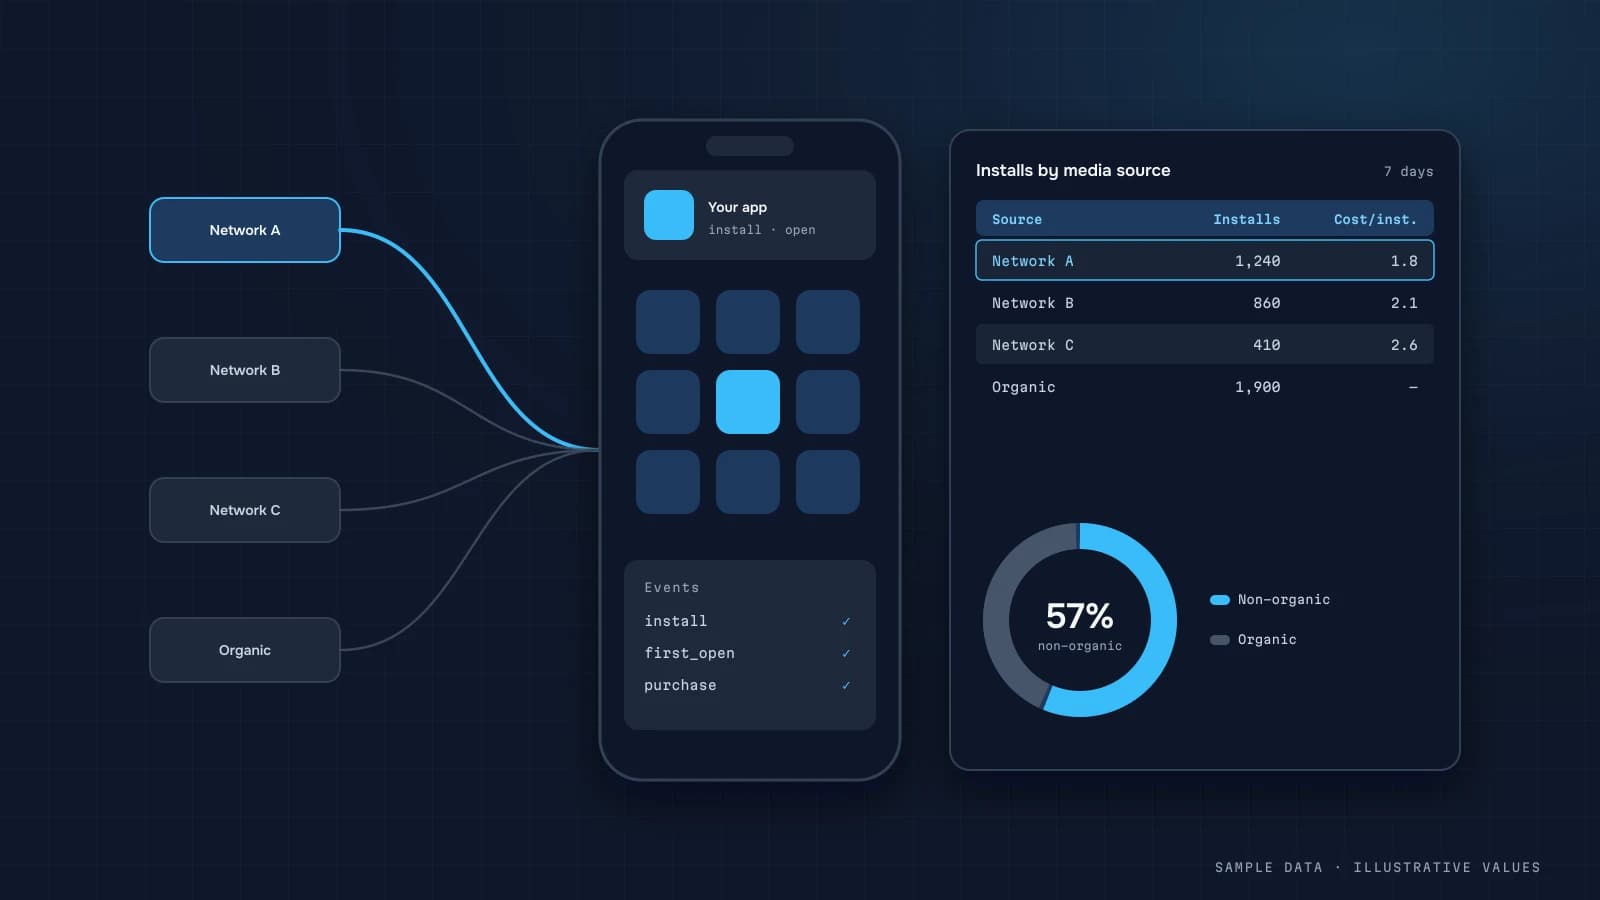
How install attribution works in AppsFlyer, what OneLink does for web-to-app journeys, what changed on iOS after ATT, and how to join MMP data with subscriptions and events to get CAC and LTV by channel.
Why GA4 revenue doesn't match your CRM or Shopify: 9 causes
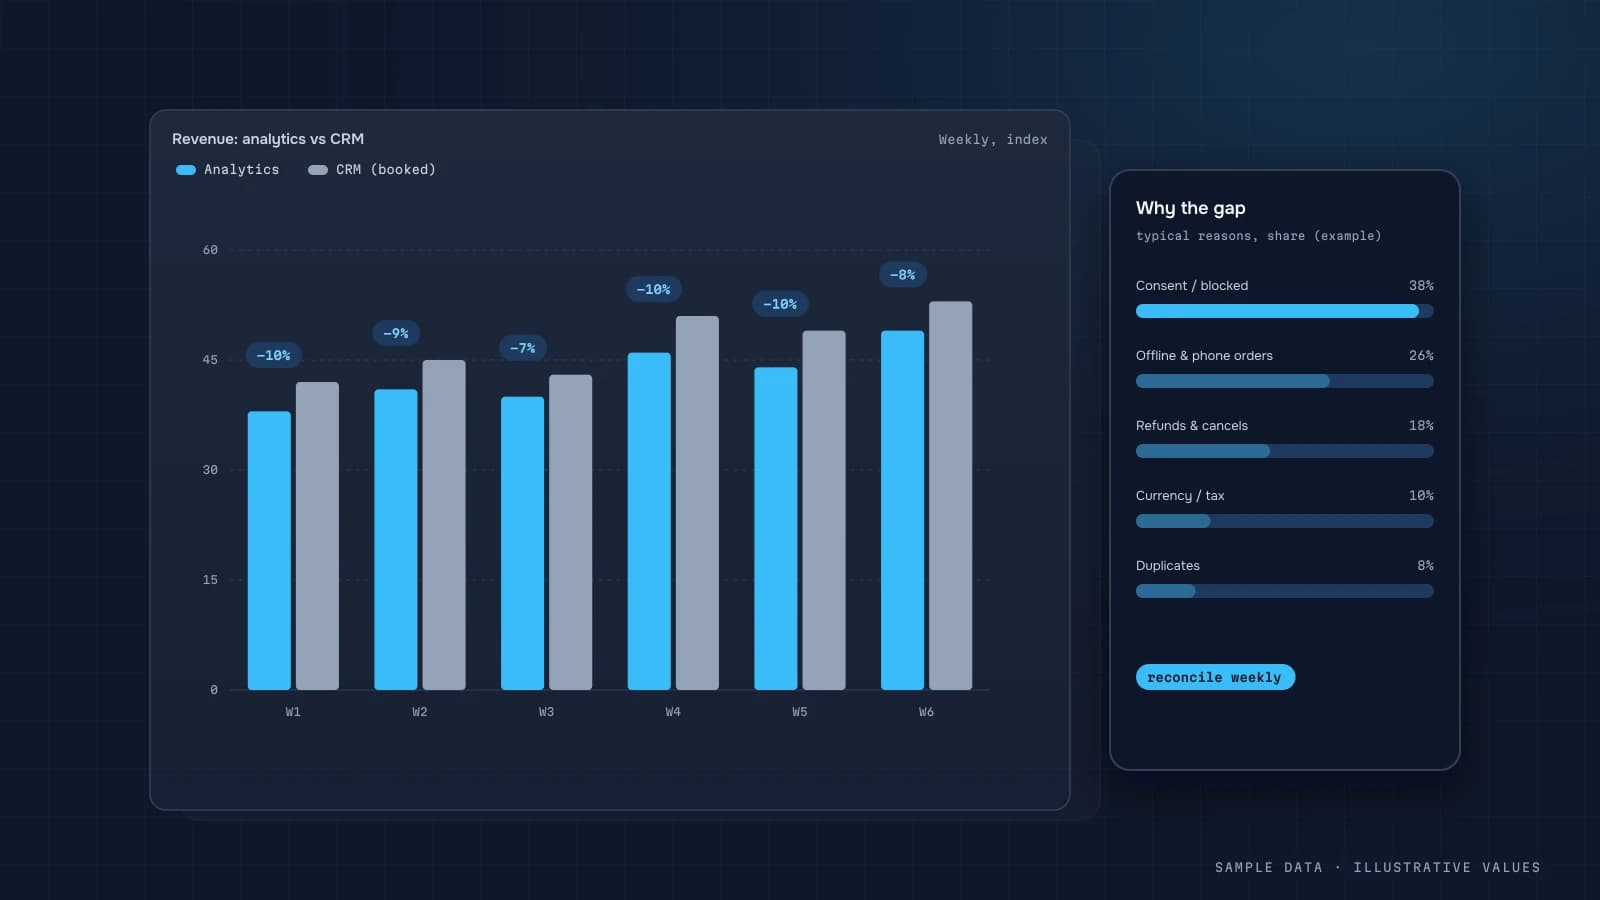
Why order counts and revenue in GA4 differ from your CRM or store backend (ad blockers, consent, hosted payment pages, duplicates, currency, time zones) and how to set up a weekly reconciliation.
Ecommerce KPIs: 15 metrics with formulas and where to get them
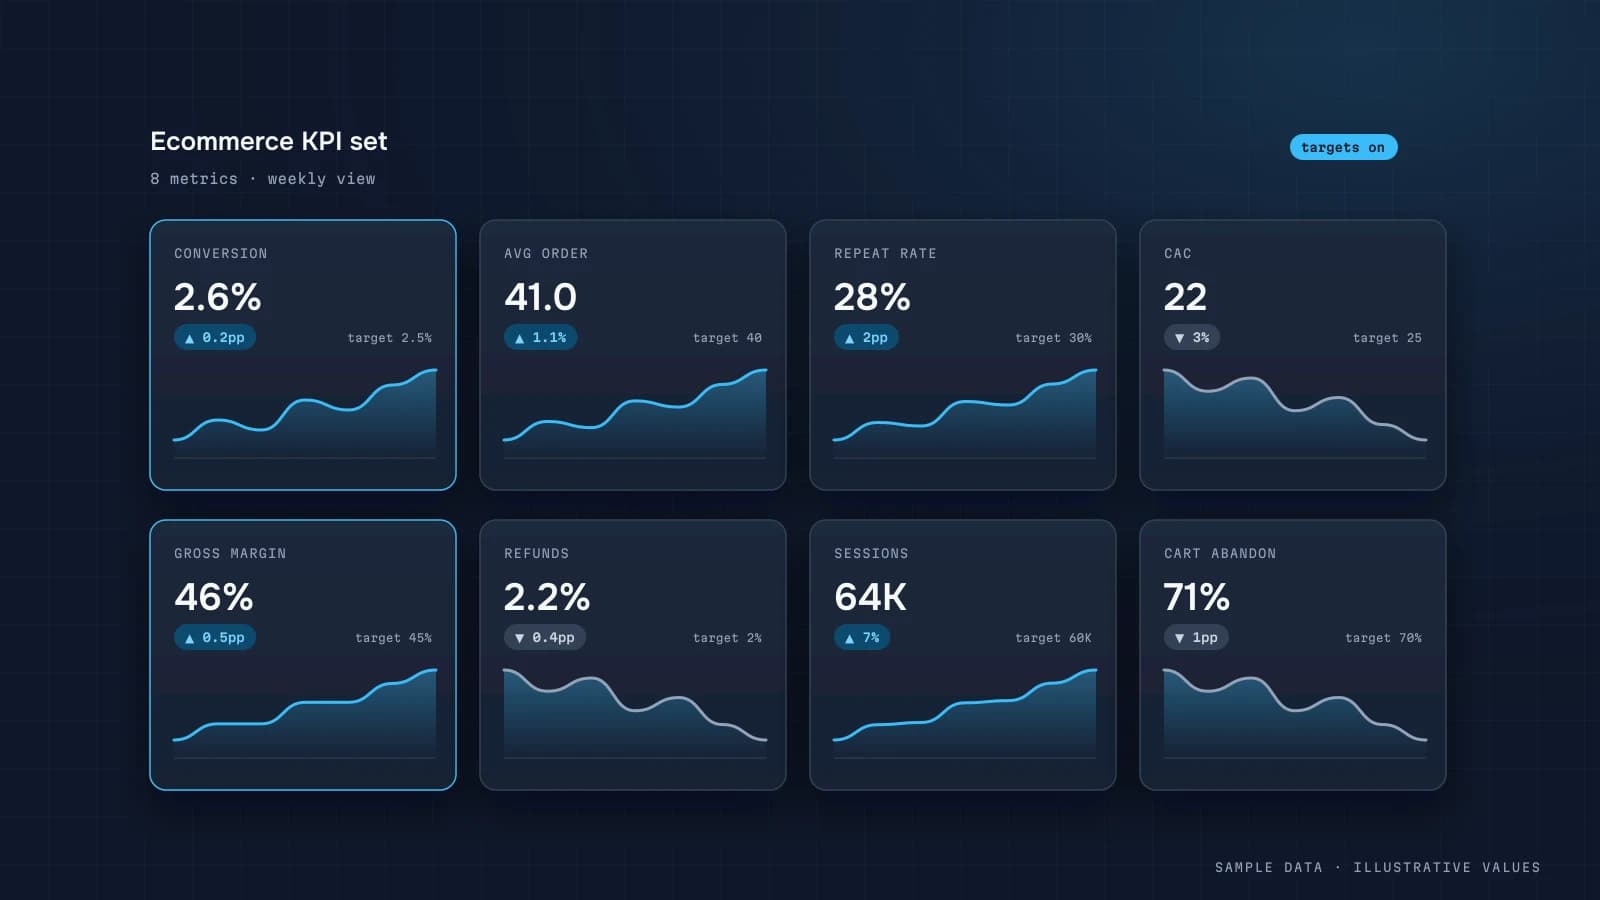
The key ecommerce KPIs with formulas (net revenue, conversion rate, AOV, margin, CAC, ROAS, MER, repeat rate, returns, stock-outs), plus which ones to check daily and which monthly.
Custom dashboard vs BI tool: which one actually pays off
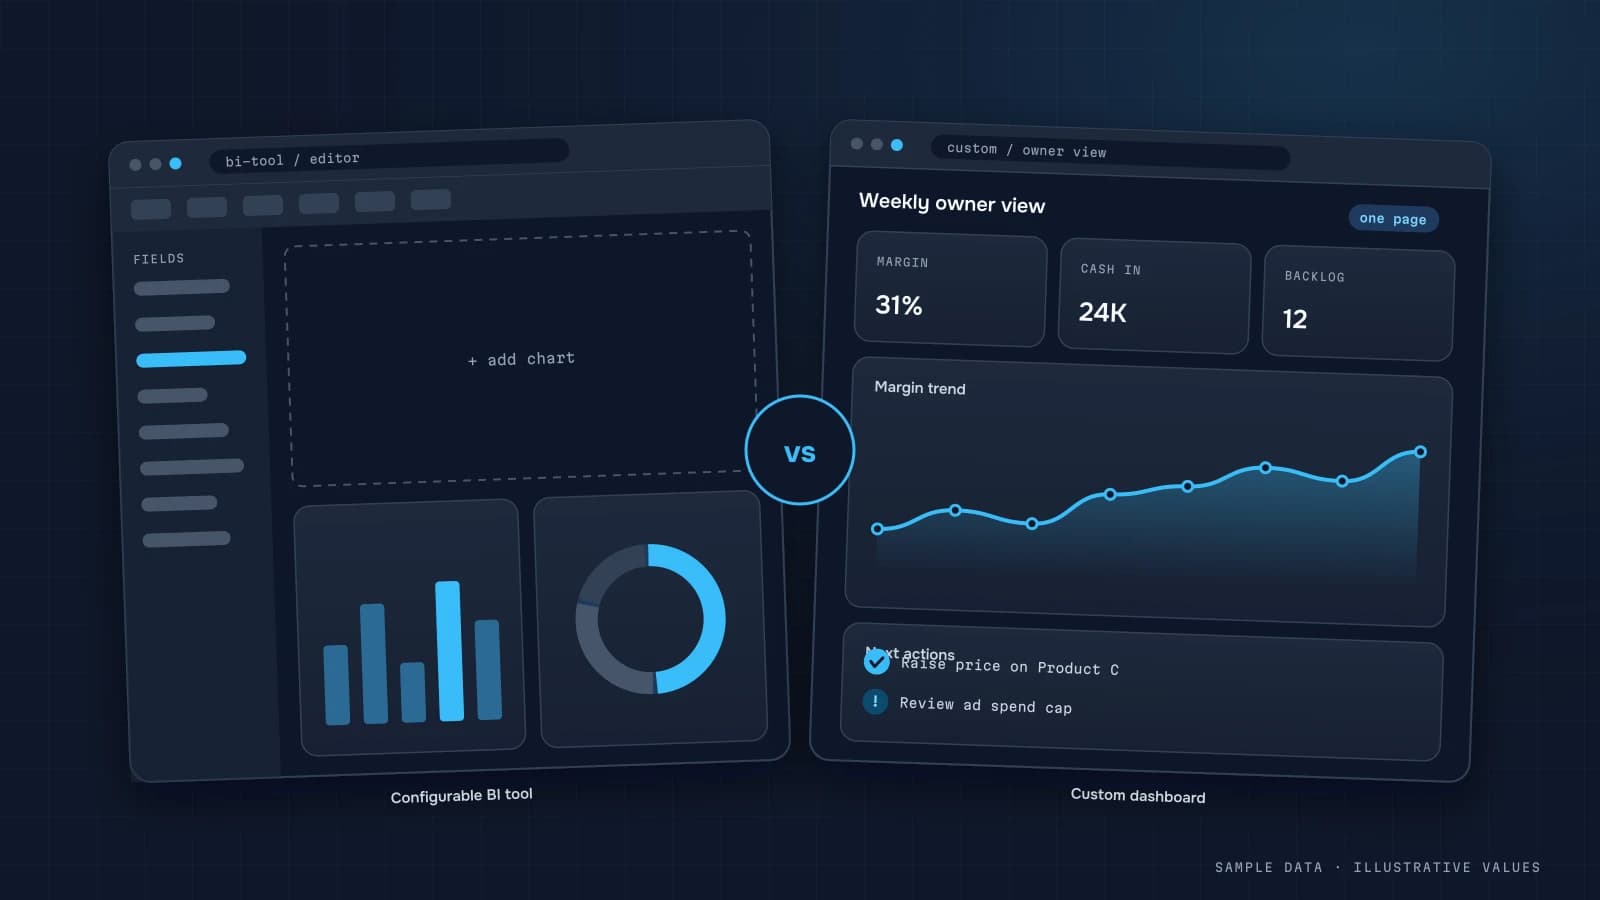
An honest comparison of a custom analytics workspace with Power BI, Looker Studio or Metabase, covering total cost of ownership, licences, branding, metric explanations, chat reports, self-hosting, and when BI clearly wins.
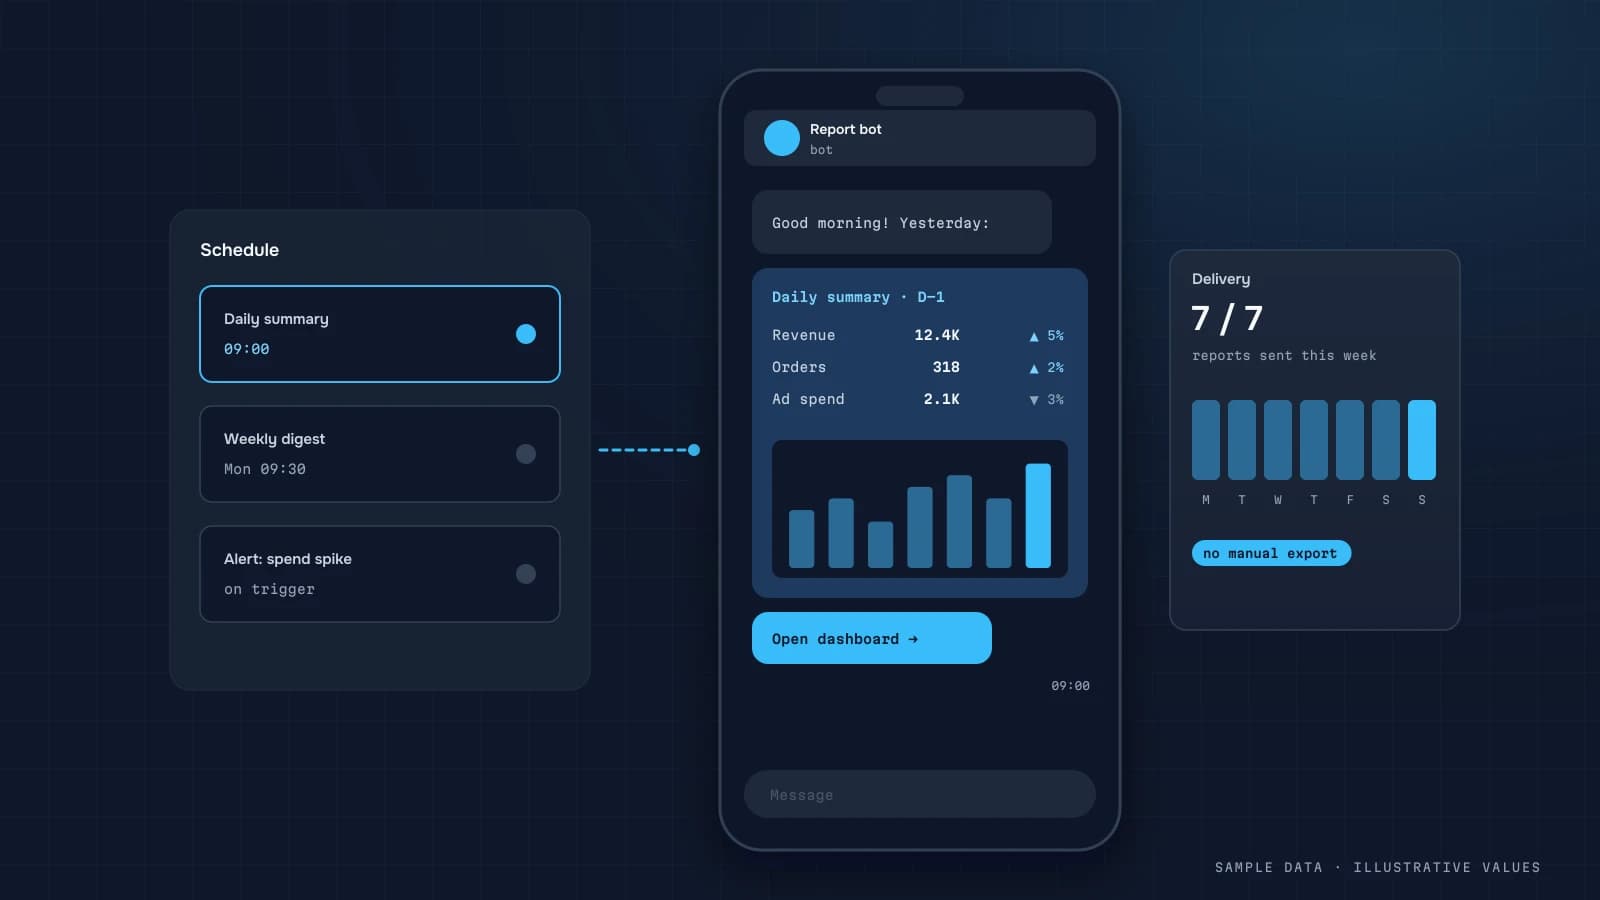
Automated KPI reports in Telegram (or Slack): daily numbers without opening a dashboard
How to set up automated KPI digests through a Telegram bot. What to include in a morning summary, how to word anomaly alerts, scheduling, token security, and a working Bot API example.
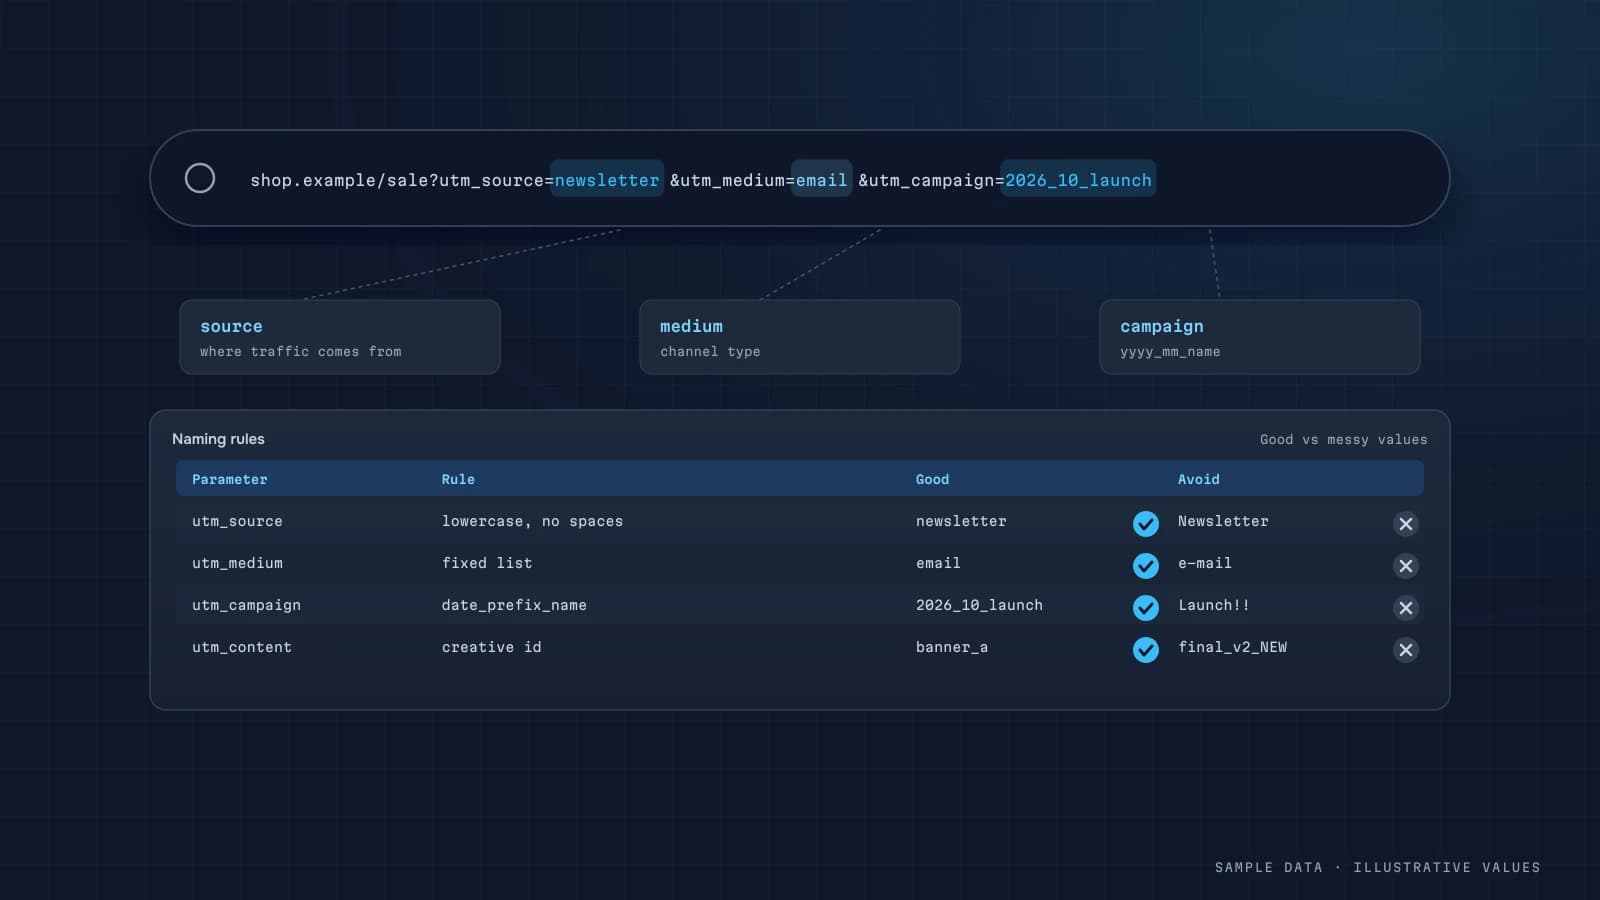
UTM naming convention: rules that don't break your analytics
How to build UTM parameters for Google Ads, Meta, TikTok, email and messengers, with one standard for utm_source, utm_medium and utm_campaign, a builder sheet template, automated validation and normalisation in reports.
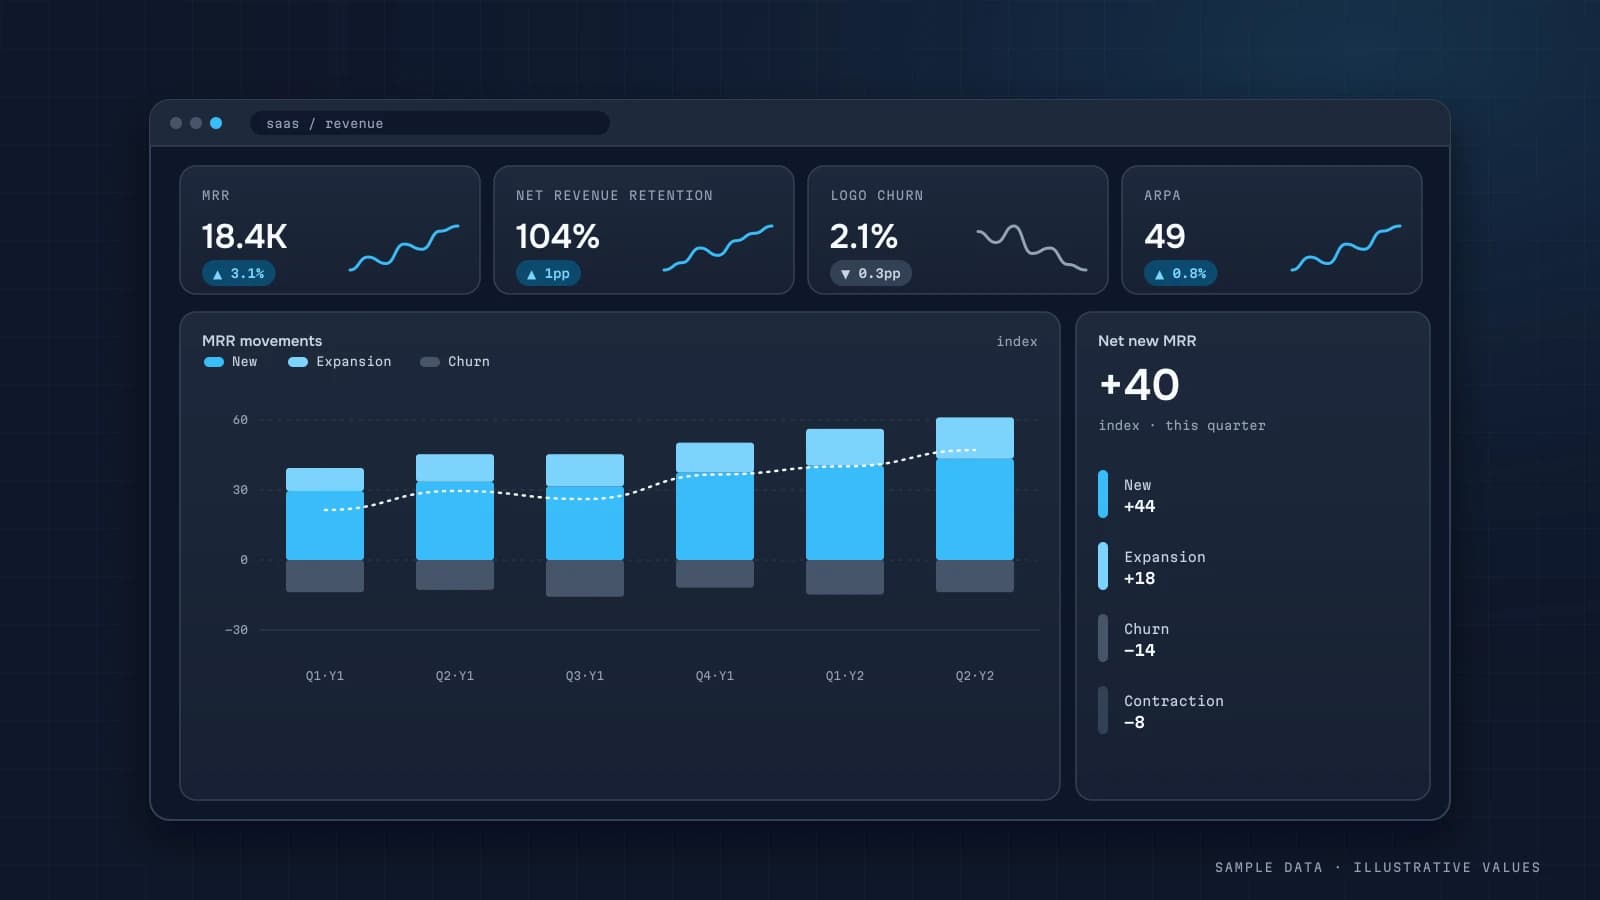
SaaS metrics dashboard: MRR, churn and activation in one place
The metrics a SaaS product or mobile app needs (MRR movements, logo and revenue churn, NRR, activation, retention, crash-free users), how to calculate them and where the data comes from.
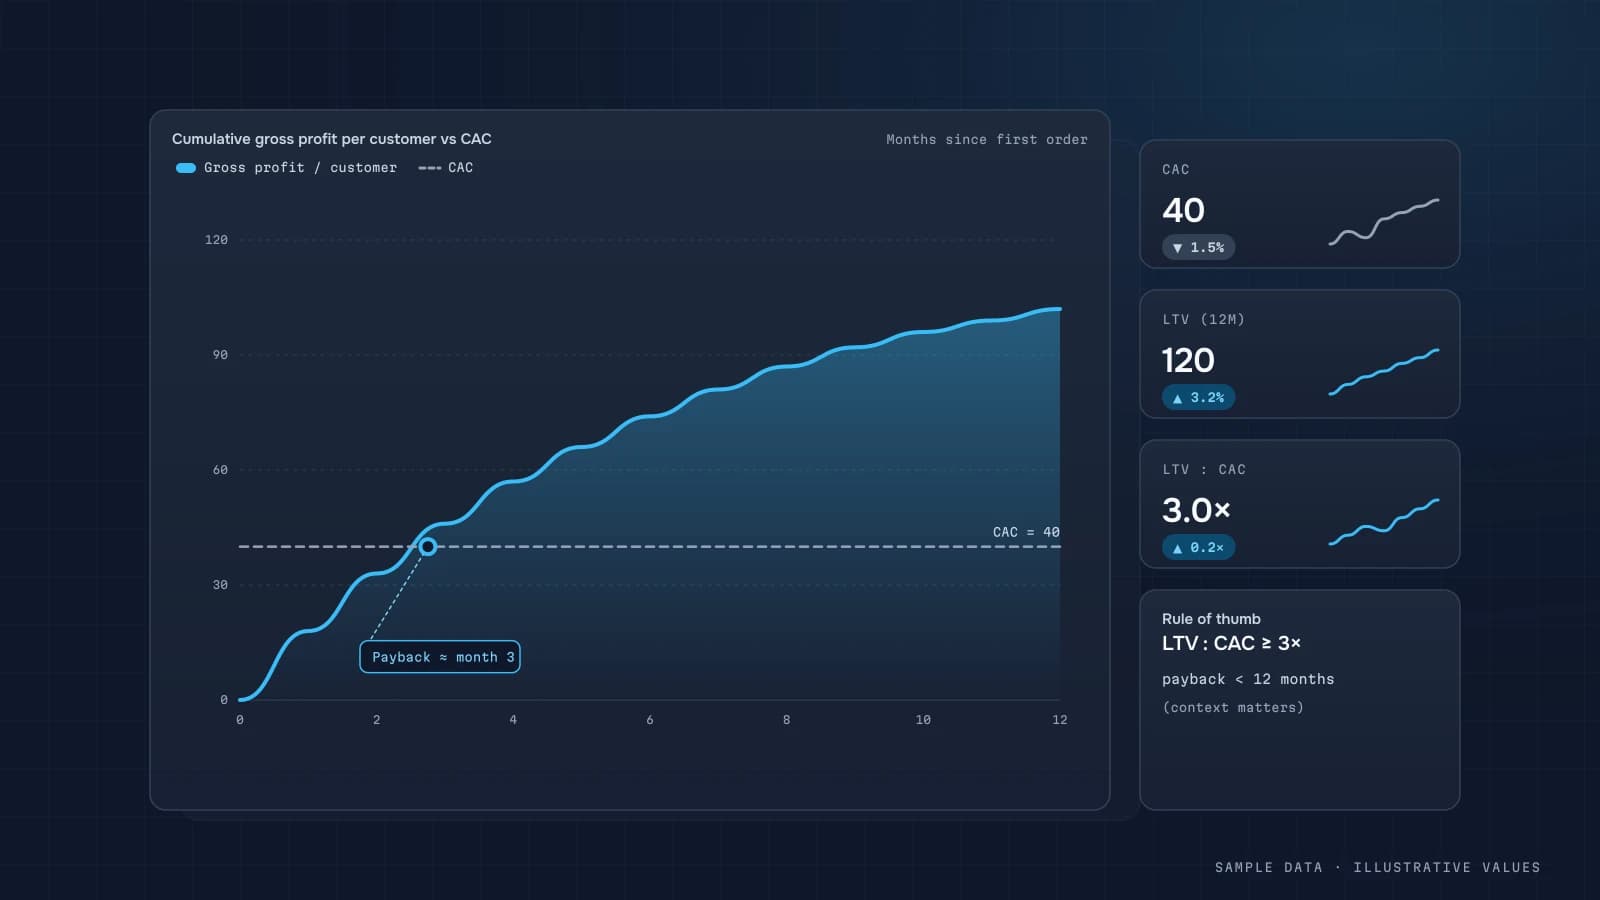
LTV to CAC ratio: how to calculate it honestly
CAC and LTV formulas for ecommerce, services and SaaS, paid vs fully loaded CAC, margin-based LTV, CAC payback in months, and why the 3:1 rule shouldn't be read literally.
GA4 ecommerce tracking setup: events, parameters and QA
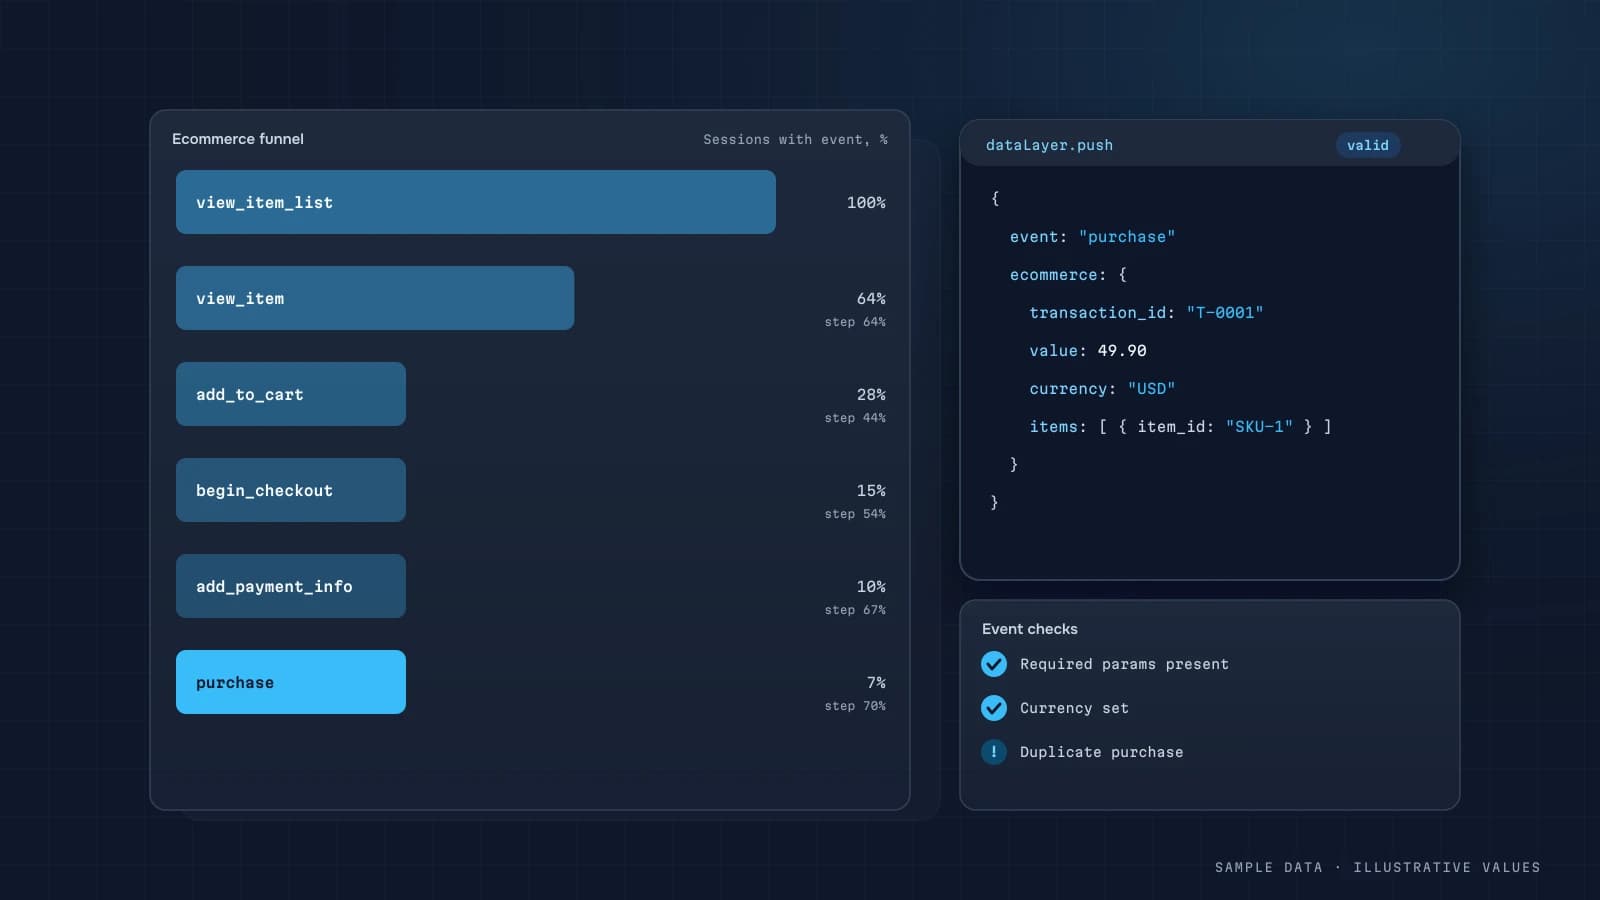
A step-by-step GA4 ecommerce setup covering the recommended events from view_item to purchase and refund, required parameters, the dataLayer, and QA in DebugView and BigQuery.
Cohort retention analysis: how to read the triangle and build it in SQL
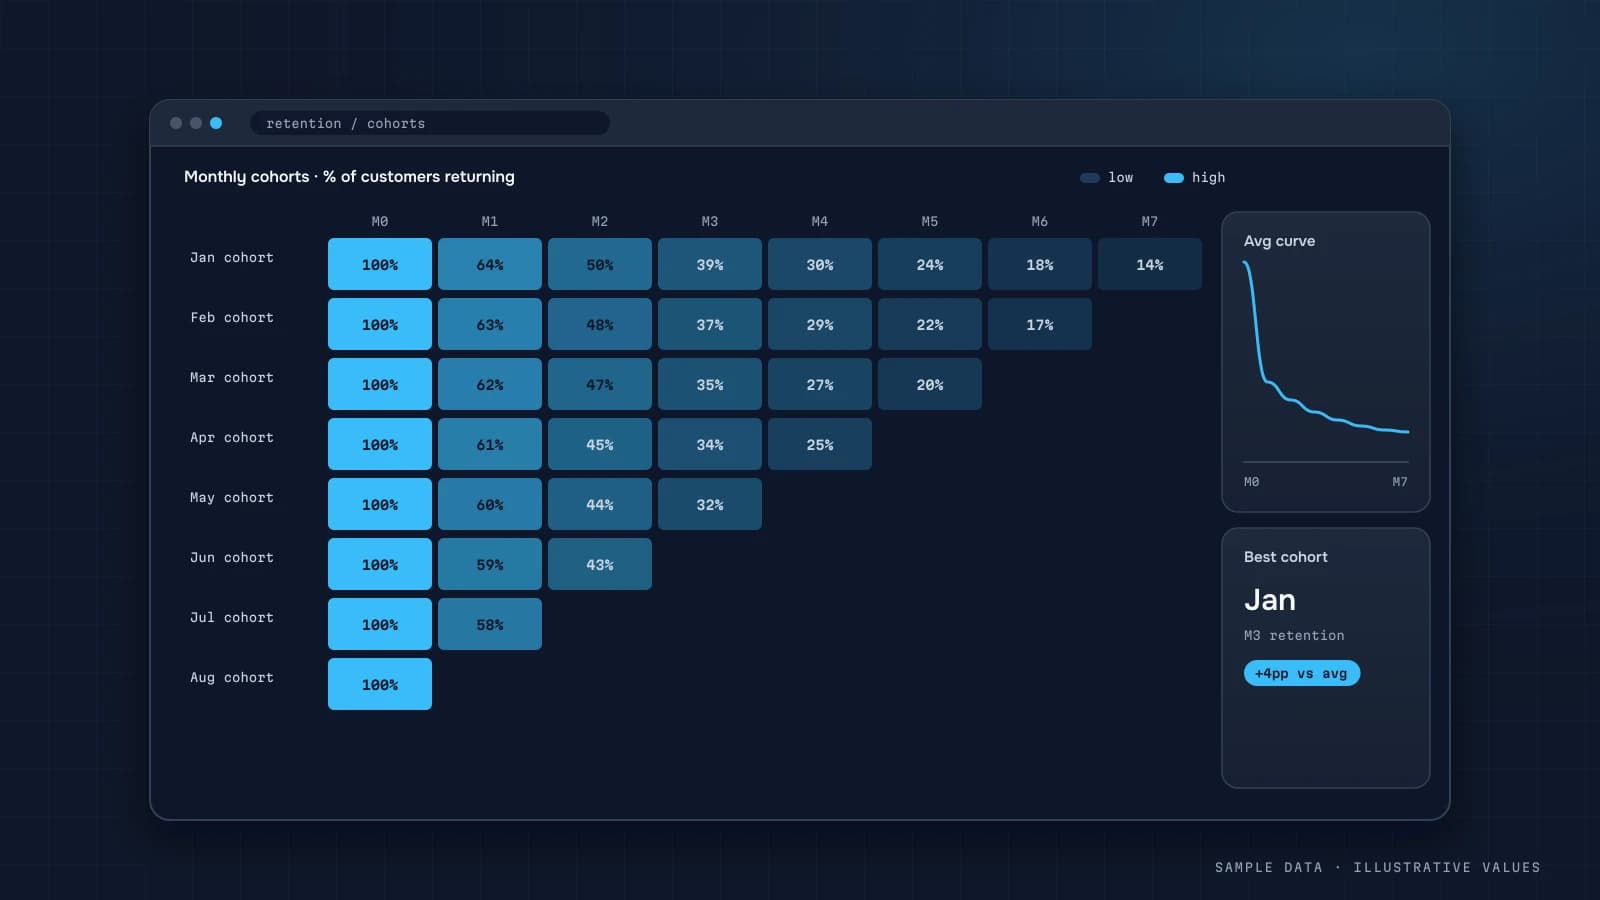
What cohort analysis is, how to build retention and cumulative LTV cohorts for a store, a service business or an app, how to read the triangle, and the decisions it should drive.
ROAS vs POAS: break-even ROAS and judging ads by profit
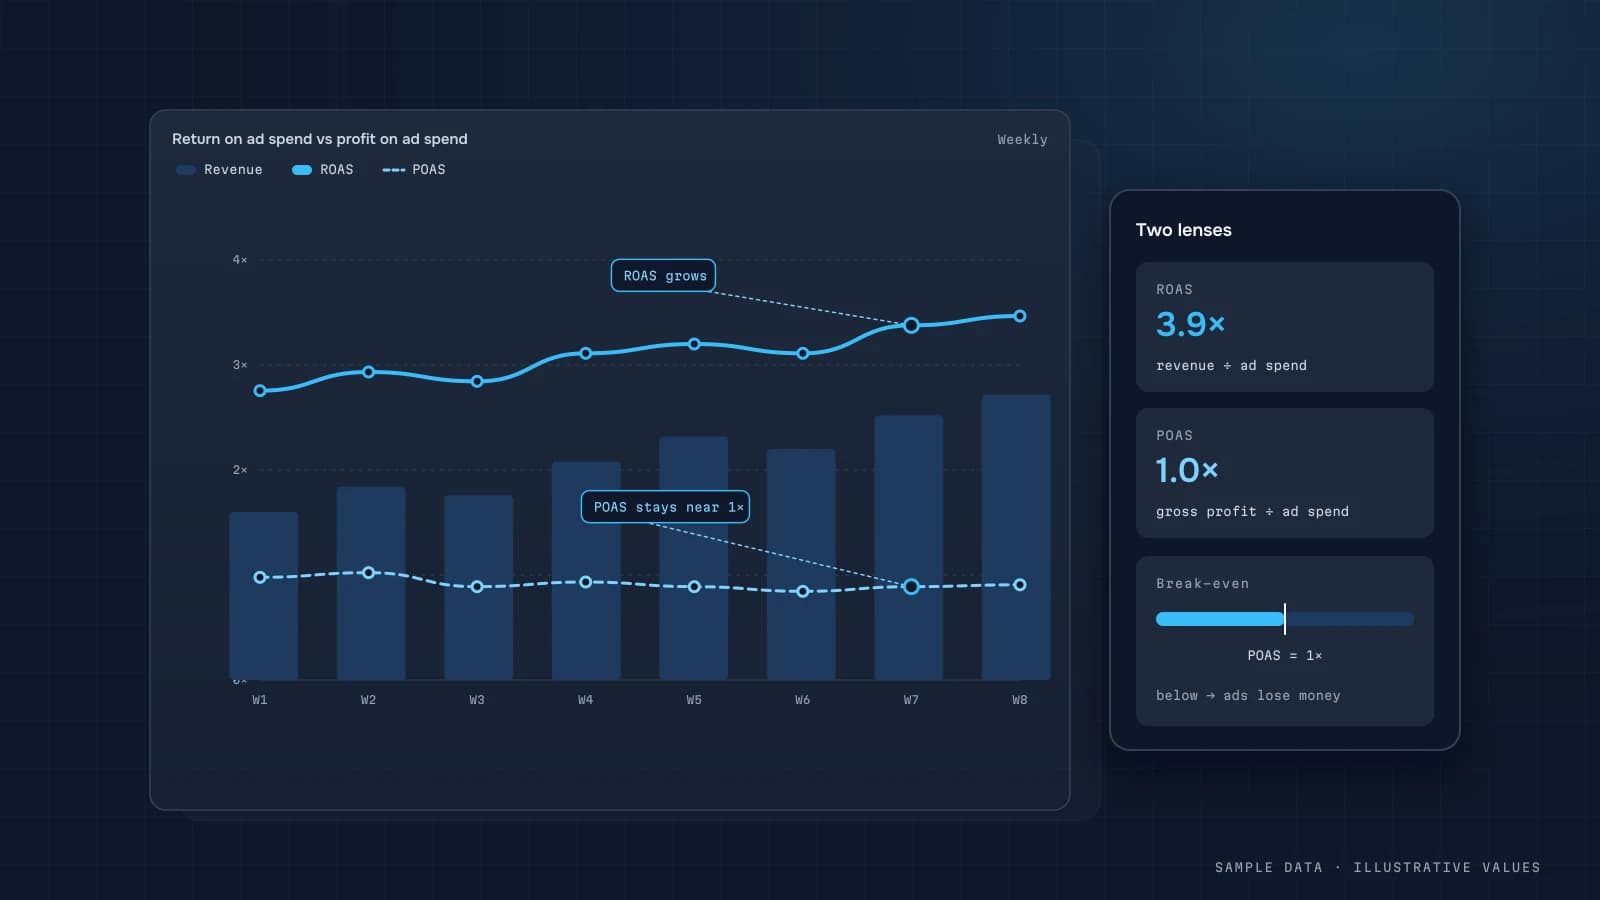
The ROAS formula, how to calculate break-even ROAS for your store, how ROAS differs from ROI, MER and POAS, and how to move your dashboard from ad revenue to ad profit.
Ecommerce dashboard: what to show and how to build it
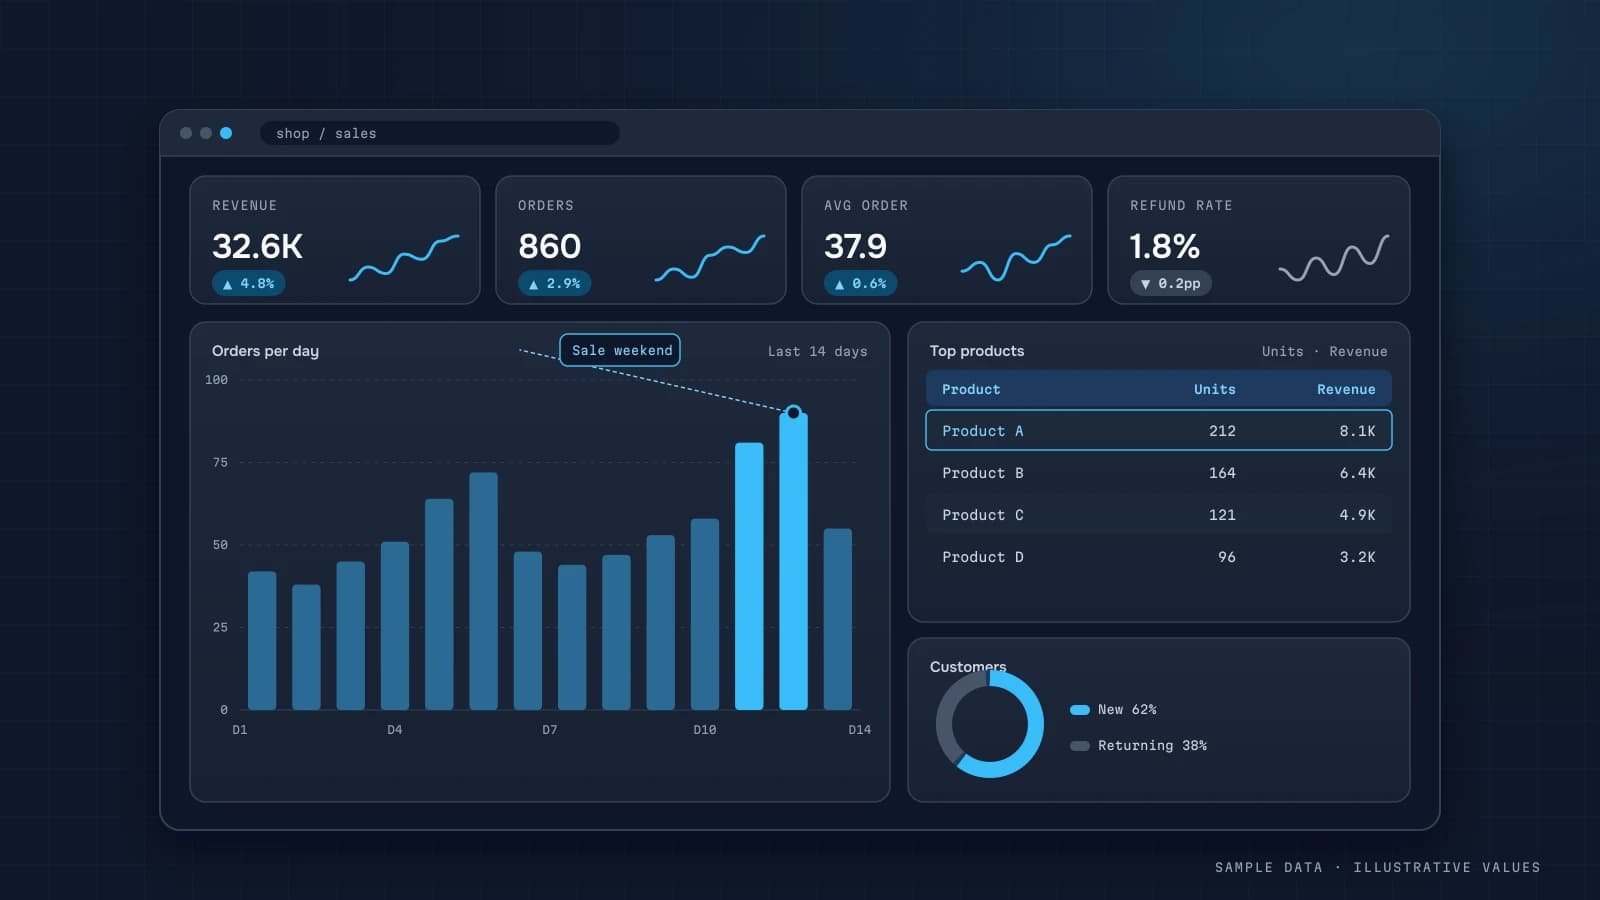
How to structure an ecommerce dashboard for Shopify, WooCommerce or a custom store, with overview, marketing, product and customer views, the data sources behind them, and a daily KPI digest.
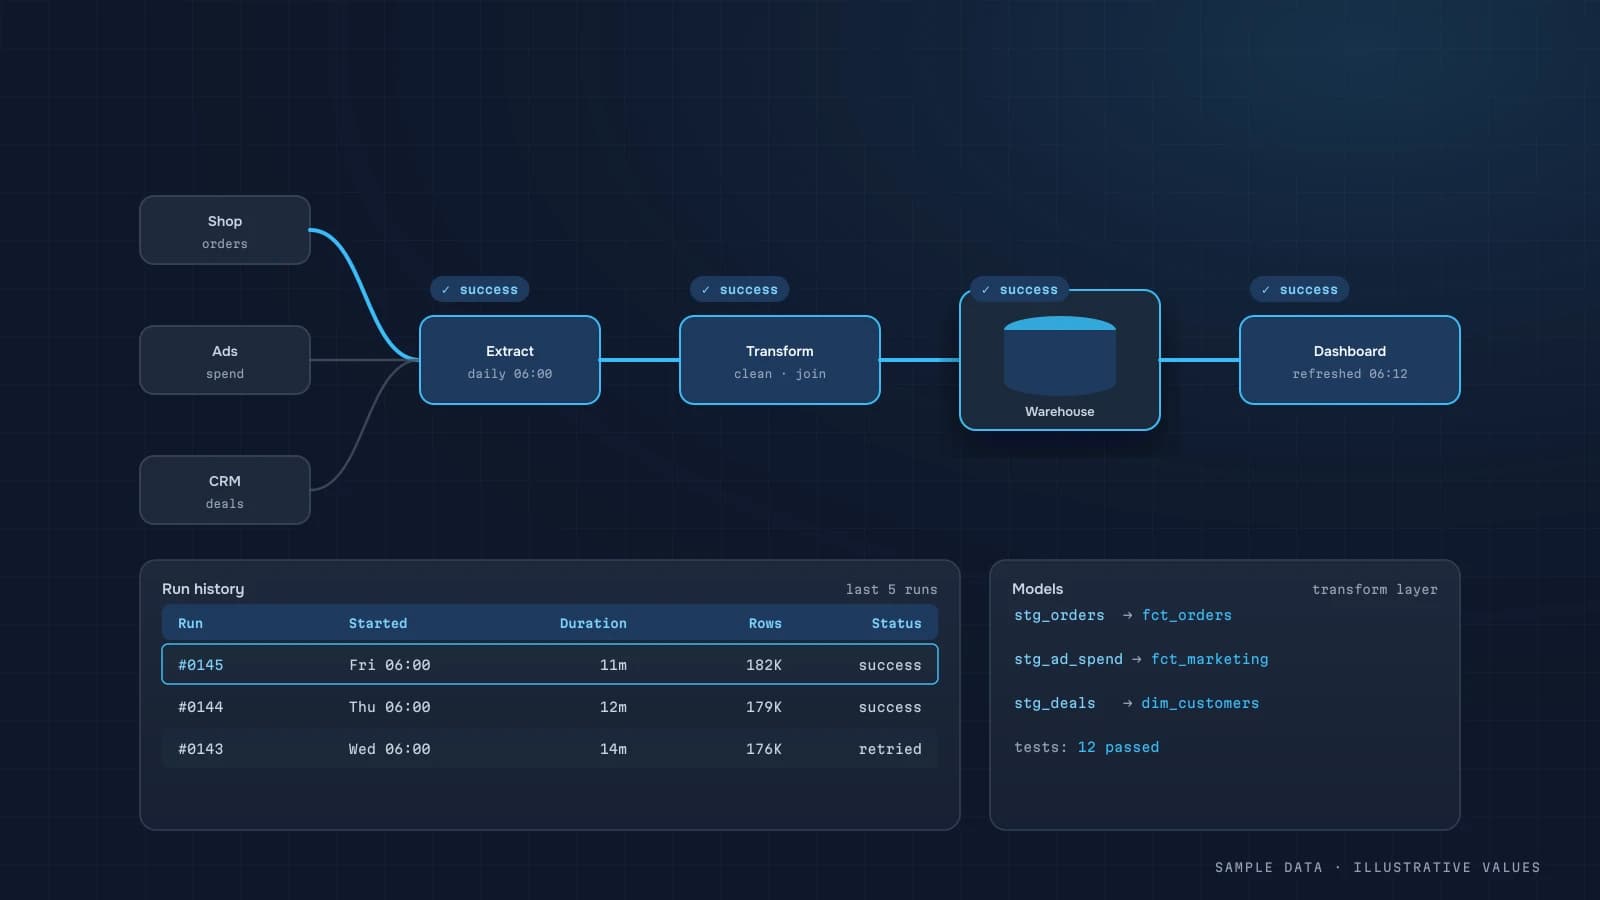
Data pipelines for small businesses: ETL without the enterprise overhead
ETL and ELT in plain language. How to bring GA4, ad platforms, your CRM, store and payments into BigQuery or PostgreSQL, what upkeep really costs, and the mistakes to avoid.
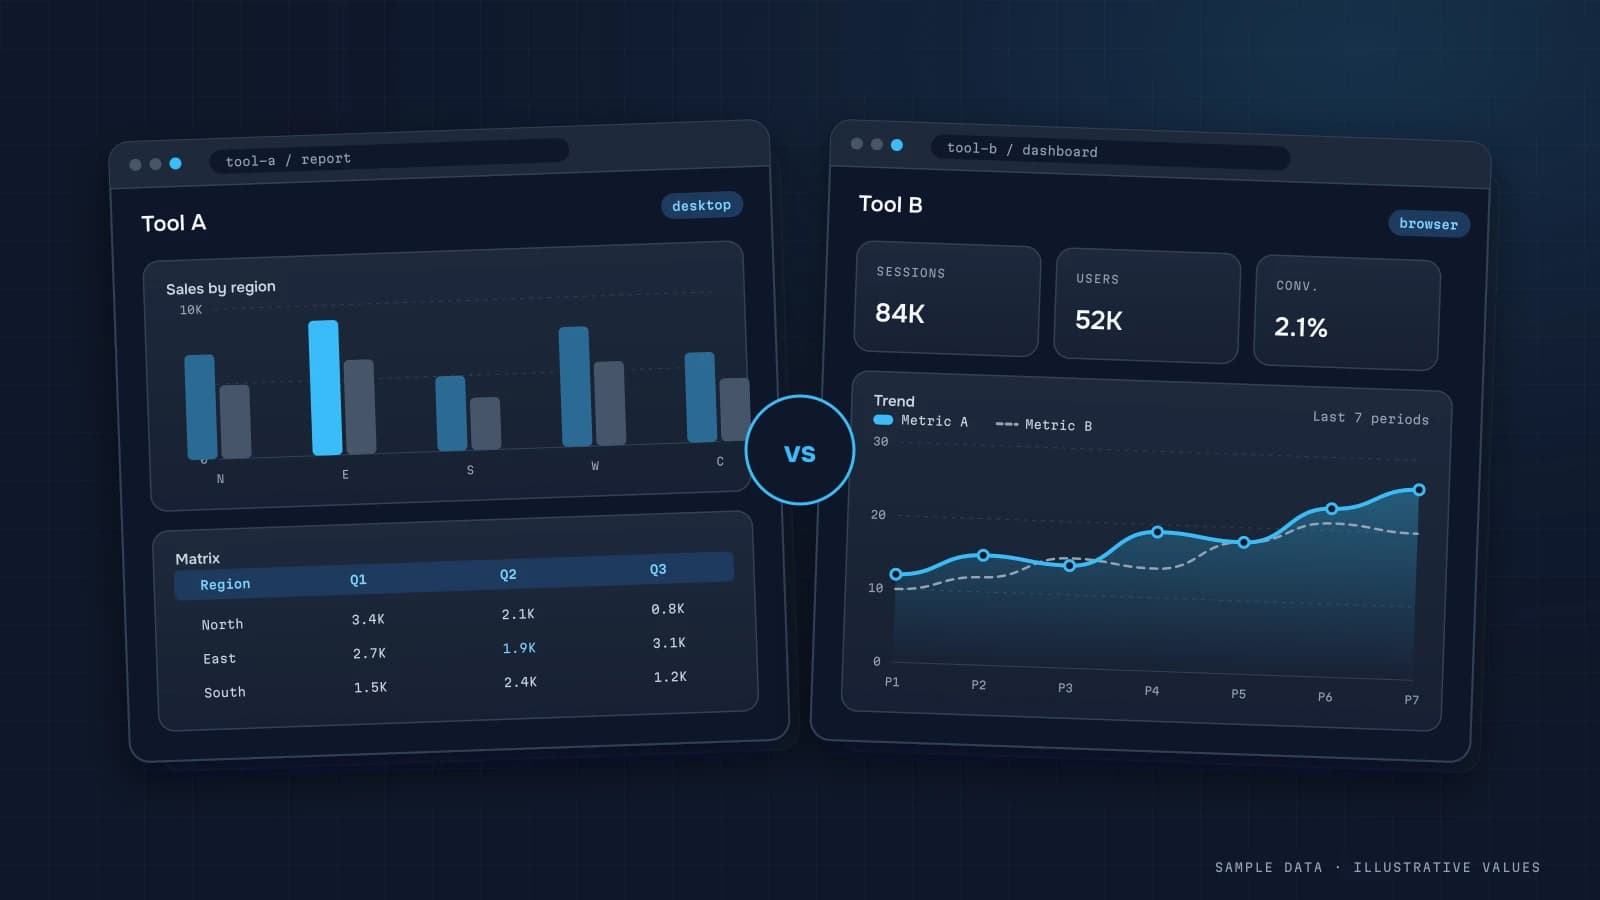
Power BI vs Looker Studio vs Metabase (and Tableau): which to choose
A vendor-neutral comparison of Power BI, Looker Studio, Metabase and Tableau for small and mid-size companies, covering data sources, licensing model, speed and learning curve, and when you need none of them.
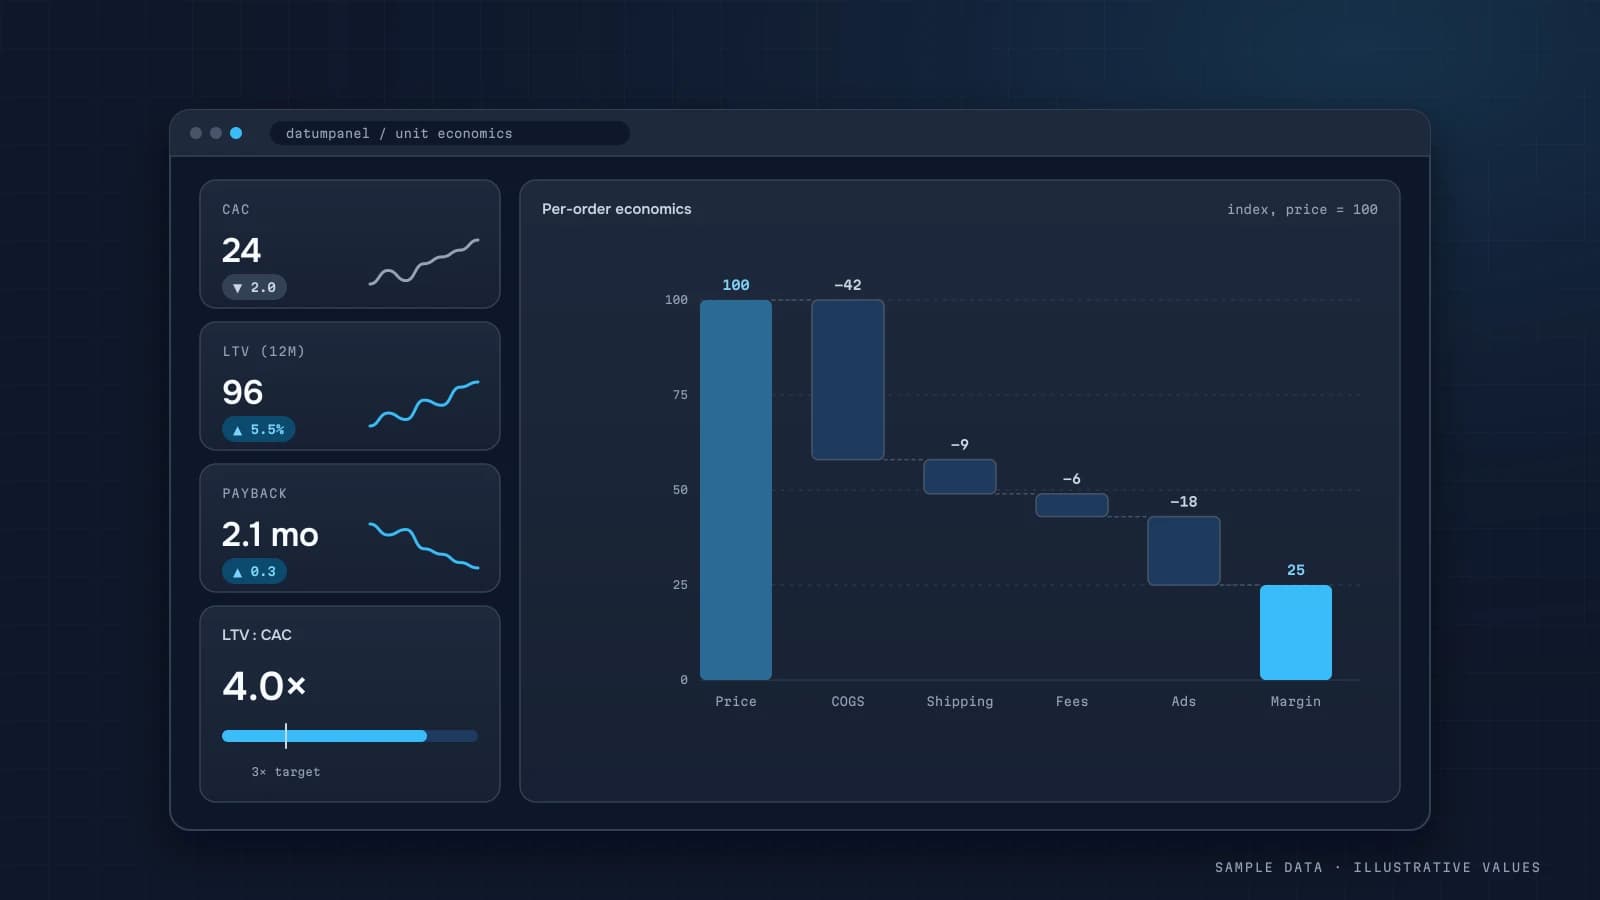
Unit economics: formulas, a worked example and a dashboard
How to calculate unit economics for an online store, a service business or SaaS (CAC, contribution per order, LTV, payback) from real CRM and ad data, and how to turn it into a dashboard you check every week.
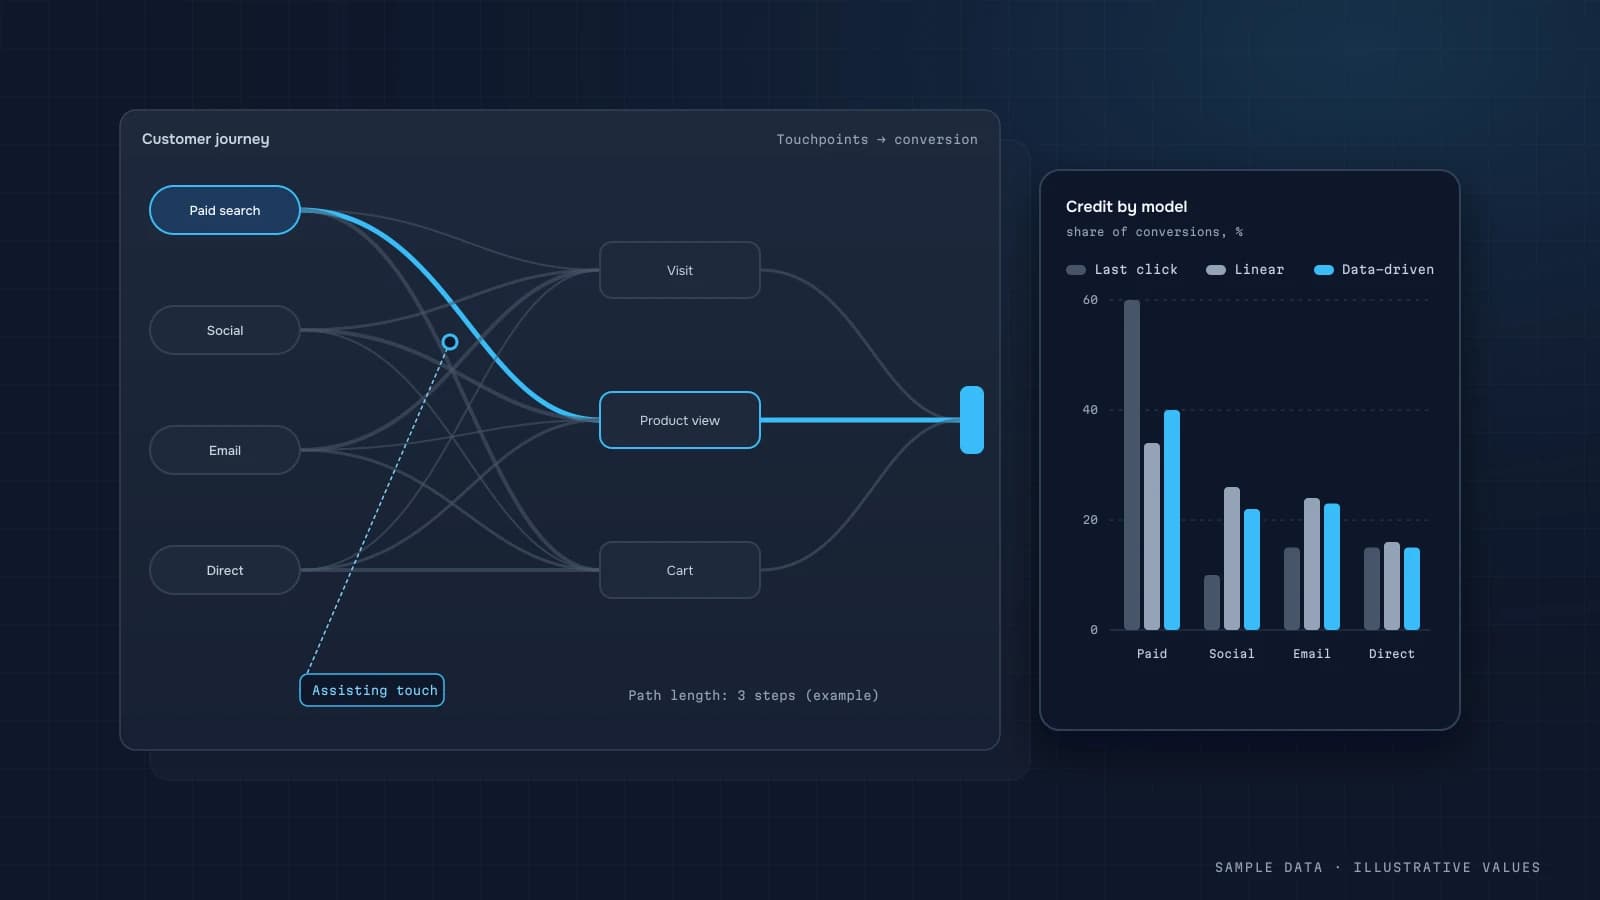
Marketing attribution models: how to measure channels honestly
How attribution models work (last click, first click, linear, data-driven), why Google Ads, Meta and GA4 all report different conversions, and how to build one channel report you can actually trust.
GA4 BigQuery export: a practical guide for business owners
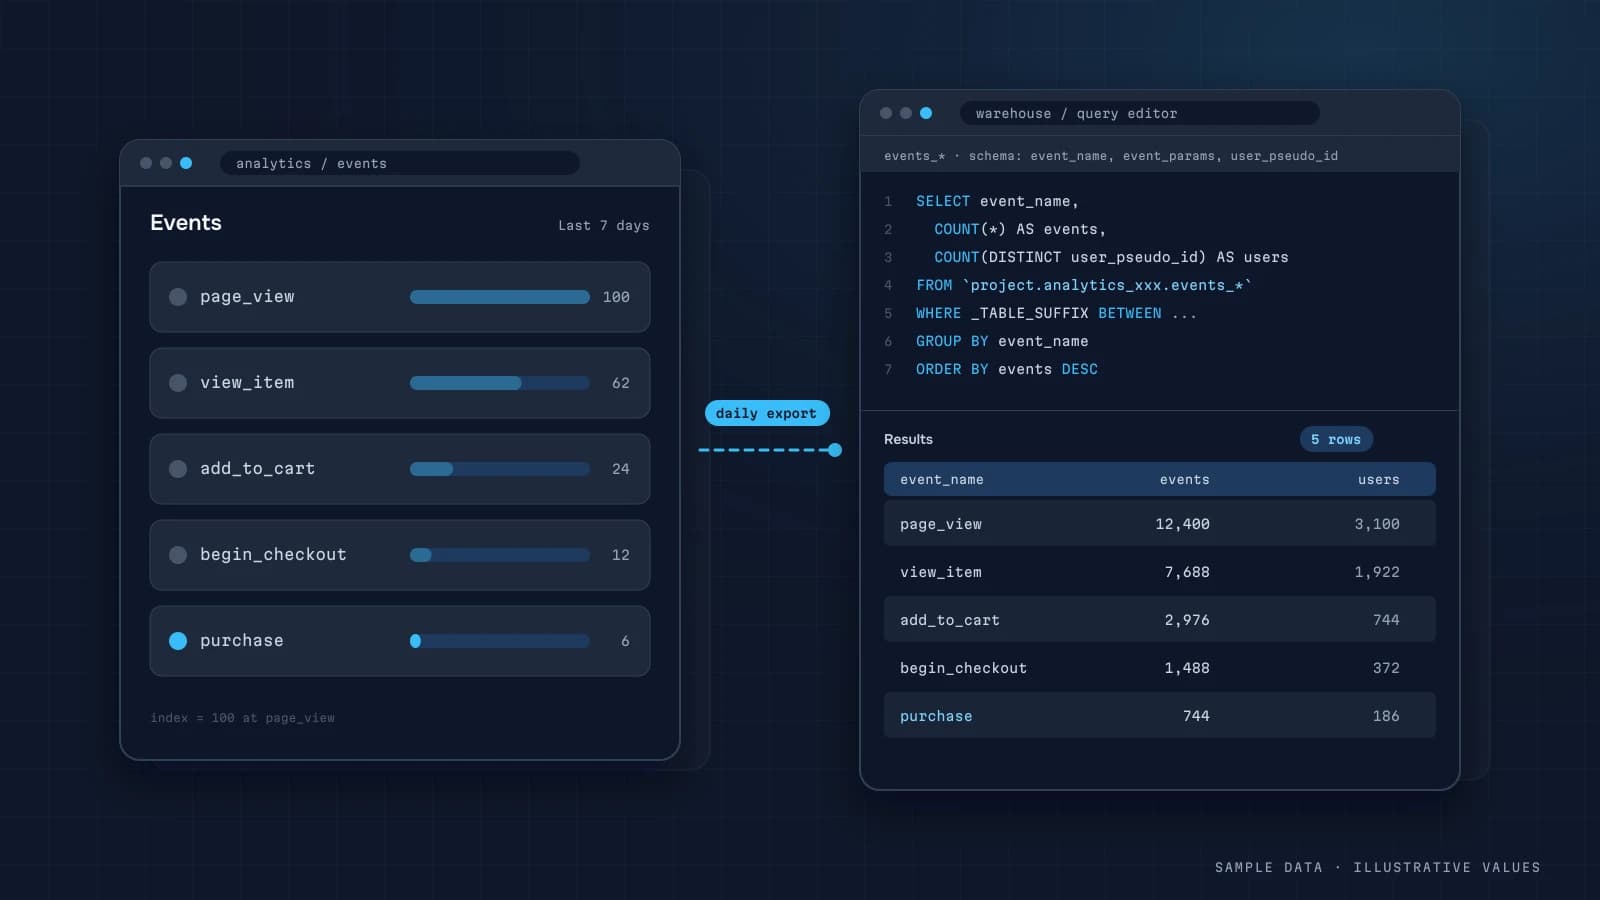
Why you should turn on the GA4 BigQuery export today, how the events_ tables and nested event_params work, what it costs, and the first SQL queries worth running.
Business dashboards: how to build one people actually open
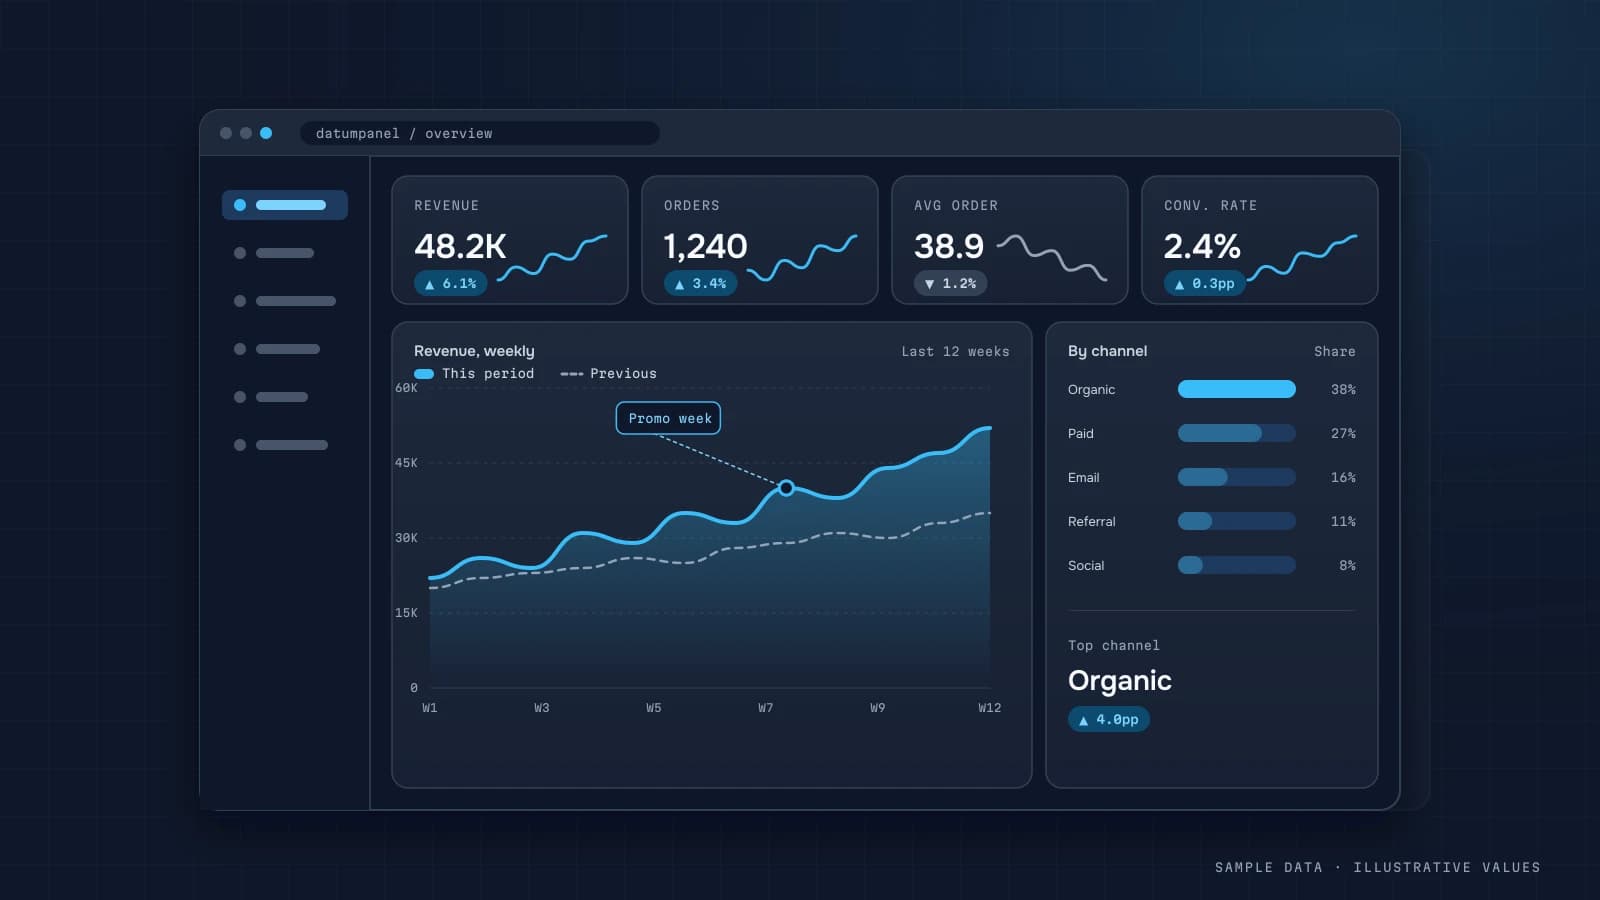
What a business dashboard is, the layers underneath it, which metrics belong on the first screen, realistic timelines, and how to avoid building yet another pretty report nobody uses.
Want this kind of analytics for your business?
Tell me what data you have and which questions it can’t answer yet. I reply the same day with a plan, a timeline and the quick wins.
Or reach me directly:
Open the demo →