Skip to content

Solution example · For marketing agencies

Client reports that build themselves.

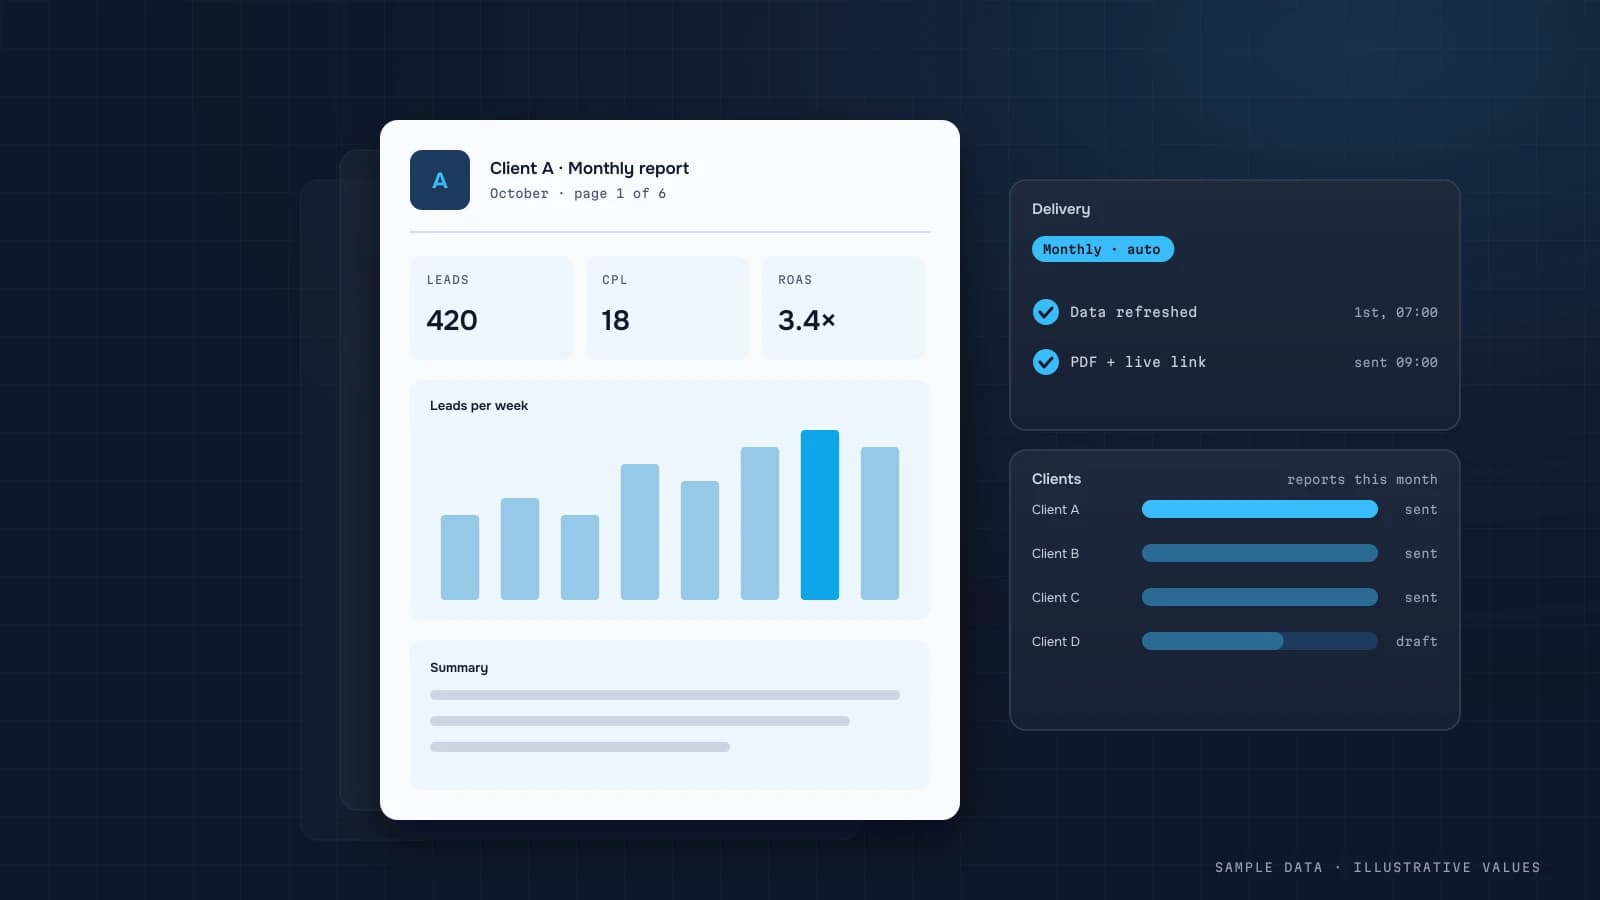
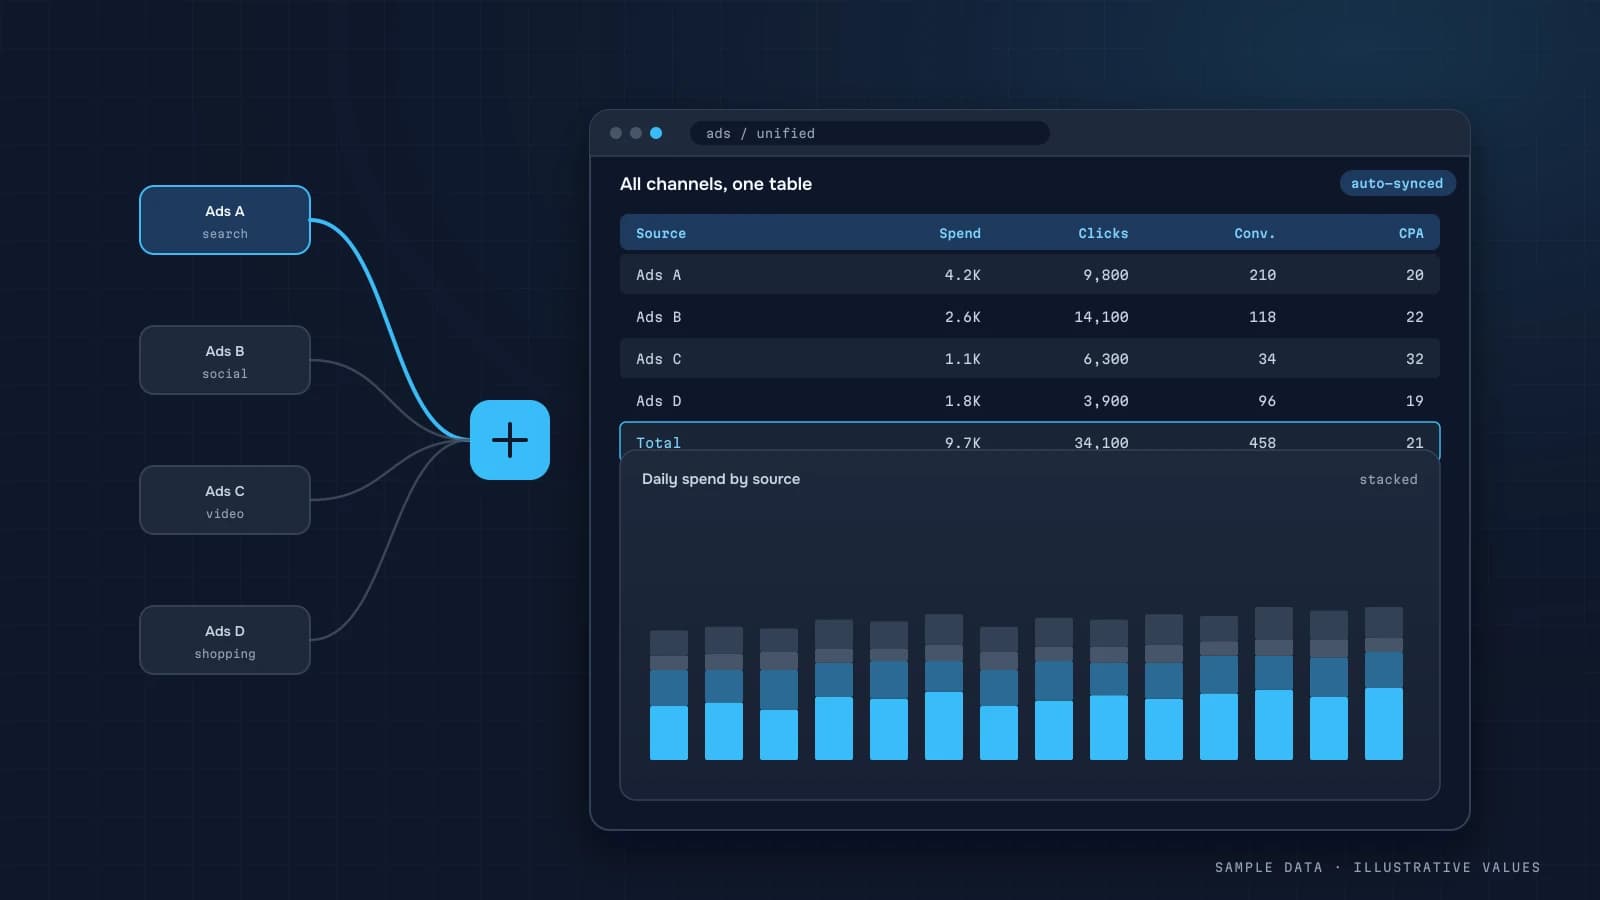
Every client’s ad accounts and sites in one place, white-label reports and Telegram digests — no Friday copy-paste.

AgenciesDesign: Classic
Client spend$74.3K11%
Leads1,93014.6%
CPL$38.56.3%
Clients17+2
Leads across all clientsThis periodPrevious period

ExplainedTwo of your 17 clients generate 40% of all leads — at the lowest CPL.

Sources
Meta AdsGoogle AdsTikTok AdsSheets
Which client needs attention right now?
AI agent“Alpha Furniture”: cost per lead rose 38% this week. Cause: the Meta campaign audience has burned out (frequency 6.2). Recommendation: refresh creatives and widen the audience.
DATUMPANEL· TelegramnowClient reportsSent white-label: 17 of 17Errors: 0
Try a design · or get a unique style built for your brand
01Call30 min
02Accessread-only
03First versionyour data
04Supportweekly

Agencies

Sound familiar?

  1. 01

    Friday means screenshots

    Your team spends hours on reports instead of optimising campaigns.

  2. 02

    Client issues surface too late

    CPL spiked on Wednesday, and you hear about it from the client on Monday.

  3. 03

    Clients don’t understand the report

    A 40-row table instead of three numbers and an explanation.

Solution example

What the dashboard shows

A starting set of metrics for this industry. We finalise the list during the audit.

Spend & budgets
by client and channel, with caps
Leads & CPL
by campaign and creative
Funnel
from impression to lead
Site traffic
GA4: channels, pages, CTAs
Search
Search Console: queries and positions
Portfolio health
which clients are at risk

Solution example

Who gets what

  • Agency lead

    «Which clients need attention today?»

    A portfolio digest with CPL and budget anomalies.

  • Account manager

    «What do I show the client in the meeting?»

    A separate, white-label client dashboard with plain-language notes.

  • Media buyer

    «Which creative has burned out?»

    CTR and CPL trends by creative with drops highlighted.

Workspace sections you’ll use here

  • Site analytics

    GA4: channels, pages, devices, a geo map, CTA clicks, site search and form funnels.

  • Search analytics

    Google Search Console: clicks, impressions, CTR and position by query, page and device.

  • Marketing

    Campaigns, funnel and attribution (AppsFlyer / OneLink), creatives and site click-throughs.

  • My dashboards

    Custom dashboards built from ready-made widgets — for a specific role or client.

  • Automated reports

    Regular digests in Telegram: daily, weekly or on your own schedule.

  • Roles & access

    Admin and viewer roles, with page-level access for each user.

Scenario

A performance agency with 17 clients

Before

Every Friday three account managers spent 4 hours pasting ad-account screenshots into decks. Clients flagged anomalies first.

After

Each client has a branded dashboard, the report goes out by itself on Monday, and the lead sees a daily portfolio view with CPL and budget alerts.

Result

Typical effect: ~12 team hours a week go back into campaign optimisation.

A generalised scenario based on typical projects; impact depends on your data.

Sample AI-agent insight

«Which client needs attention right now?»

“Alpha Furniture”: cost per lead rose 38% this week. Cause: the Meta campaign audience has burned out (frequency 6.2). Recommendation: refresh creatives and widen the audience.

Sample Telegram report

Client reports

Sent white-label: 17 of 17

Errors: 0

Typical sources:

  • Meta Ads
  • Google Ads
  • TikTok Ads
  • GA4
  • Search Console
  • HubSpot / Sheets

Plans

Three ways to get started

Start with a micro-dashboard on your spreadsheets, a ready-made template for this industry, or analytics built entirely around your processes.

01Timeline: 1–2 weeks

Lowest-cost start

Micro-dashboard

A static report from your existing data and spreadsheets (Excel, Google Sheets, CSV or a database) — hosted on GitHub Pages or Vercel. A strong fit for entrepreneurs, sole traders and individuals.

  • Excel, CSV or Google Sheets as input
  • 1–3 screens with key charts
  • Static hosting — near-zero running cost
  • Updates on request or on a schedule
02Timeline: 2–4 weeks

Ready-made dashboard

A proven template for your industry, connected to your own data.

  • The key metrics for your industry
  • Plain-language notes on every metric
  • Reports in Telegram
  • Six designs to choose from
03Timeline: 4–8 weeks

Done-for-you analytics

Reports, models and ongoing support built around your questions.

  • Data and metrics audit
  • Any source or API
  • An AI agent trained on your data
  • Regular insights from an analyst

FAQ

The short version

Can the dashboard be branded per client?

Yes: name, logo and colours are configurable, and there are six designs to choose from.

Does each client see only their own data?

Yes — roles and page access are set per user.

How many clients can we manage?

There’s no hard limit; I’ll design the setup around your portfolio.

Read more on the blog

All blog articles →

Give your team their Fridays back.

I’ll show you what a report for your biggest client would look like.

Or reach me directly:

Open the demo →

Send a request

I reply within one business day.

What are you interested in
Industry
A few more details · optional
Approximate budget · optional
When to start · optional
Data sources you have · optional

By submitting, you agree to the Privacy policy — your contact details are used only to reply to this request.