Google Ads, Meta and TikTok in one dashboard: cross-channel ad reporting
How to combine spend and results from Google Ads, Meta Ads and TikTok Ads into one report, covering a shared schema, currencies, time zones and retroactive conversion updates, then add backend orders so you see real ROAS.
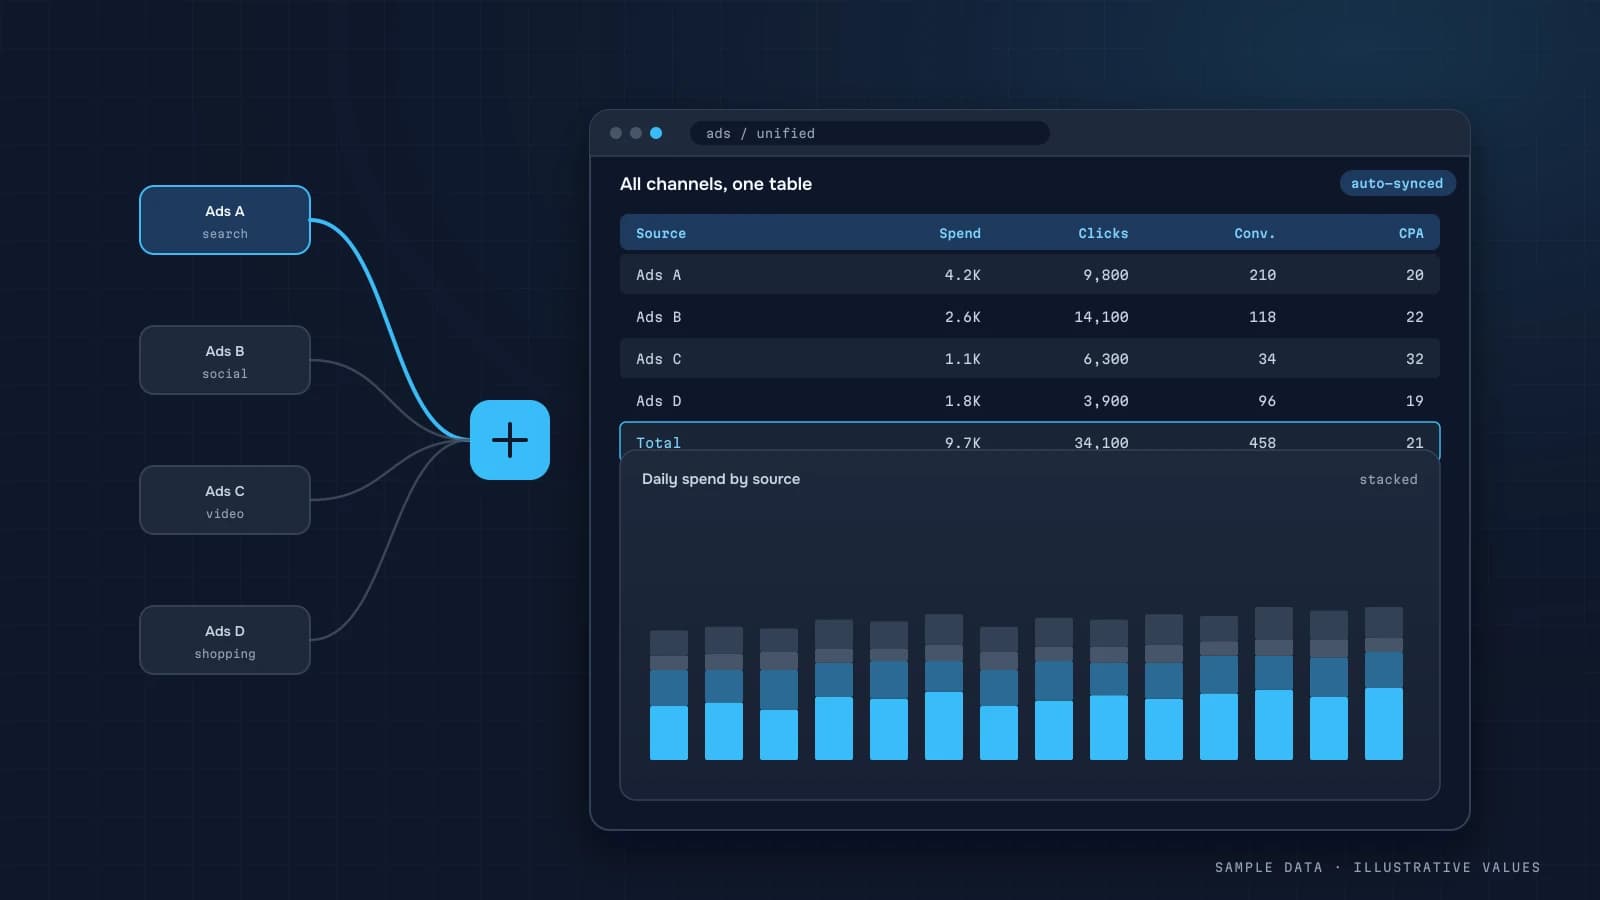
Every Monday the marketer opens three ad platforms, copies numbers into a spreadsheet, converts currencies and builds a chart. A cross-channel report does all of that automatically. More importantly, it puts real sales from your backend next to the platforms' own "conversions."
A shared schema
Every platform names things differently, so step one is mapping them all into a single table:
| Field | Google Ads | Meta Ads | TikTok Ads |
|---|---|---|---|
date | segments.date | date_start | stat_time_day |
platform | meta | tiktok | |
campaign_id, campaign | campaign | campaign | campaign |
adset / ad_group | ad group | ad set | ad group |
ad | ad | ad | ad |
spend | cost (micros) | spend | spend |
impressions, clicks | ✓ | ✓ | ✓ |
platform_conversions | conversions | actions (purchase) | conversions |
platform_value | conversions value | action_values | value |
Details people trip on:
- Google Ads reports cost in micros, so divide by 1,000,000.
- The ad account currency may differ from your reporting currency. Convert at the daily rate.
- The ad account time zone defines the "day," so align it with your backend.
- Conversions get updated retroactively, so reload the last 7–30 days on every run.
Adding backend sales
Platform conversions are useful for optimisation. The founder's report needs the truth from your backend:
- Store UTMs and click IDs (
gclid,fbclid,ttclid) on the order or lead (UTM convention). - Match orders to campaigns by
utm_campaignor campaign ID. - Show side by side: spend, platform conversions, backend orders, backend revenue, platform ROAS, backend ROAS.
| Channel | Spend | Platform conversions | Backend orders | Platform ROAS | Backend ROAS |
|---|---|---|---|---|---|
| Google Ads | 5,200 | 410 | 340 | 6.1 | 4.9 |
| Meta Ads | 6,100 | 520 | 260 | 5.4 | 3.2 |
| TikTok Ads | 1,800 | 140 | 60 | 4.0 | 2.1 |
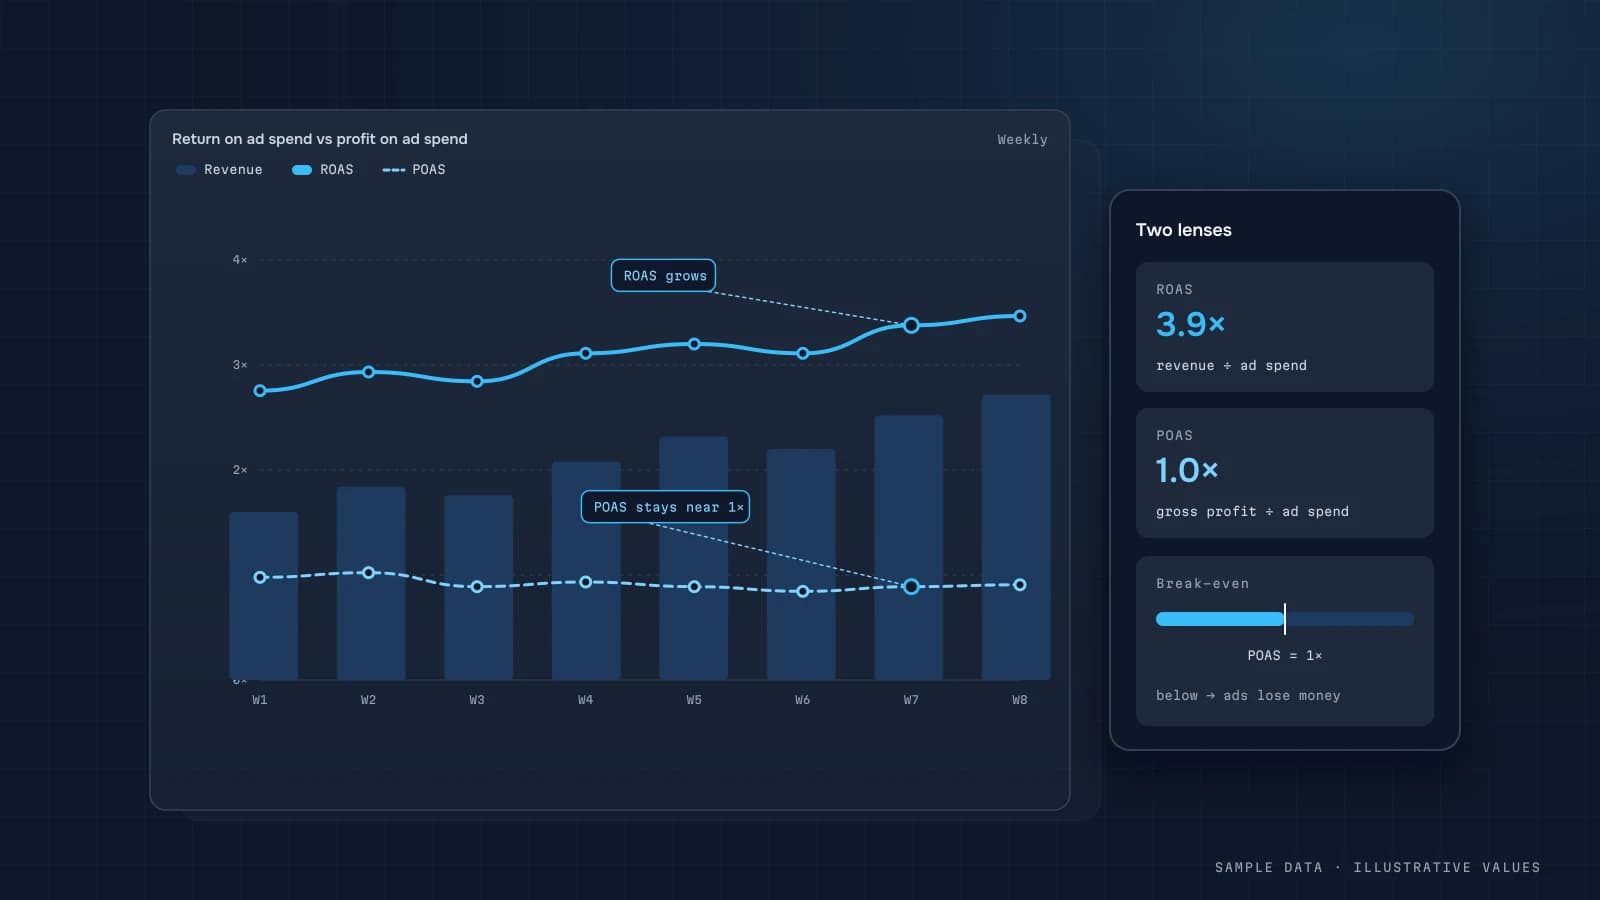
Illustrative. A gap between the columns is normal, and the attribution guide explains why. What matters is that budget decisions use the right-hand side of the table, with MER as the top-level sanity check (ROAS vs POAS).
Report structure
Overview: total spend, MER, new customers and CAC for the week, with comparisons.
Channels: the table above, plus spend and backend ROAS trends over 8–12 weeks.
Campaigns: sortable by spend, ROAS and CPA, with campaigns spending without orders flagged.
Creatives: CTR, CPC and frequency over time. Creative fatigue shows up as rising CPC and frequency.
Pacing: spend against the monthly plan, which matters most for agencies (agency reporting).
Getting the data
| Option | Pros | Cons |
|---|---|---|
| Native exports (Google Ads → BigQuery Data Transfer) | free or cheap, reliable | Google only |
| Managed connectors | fast, many platforms | subscription, limits |
| Custom API scripts | flexible, any field | needs upkeep when APIs change |
In practice I usually mix them: Google Ads via Data Transfer, Meta and TikTok via small custom loaders (pipelines). Access is read-only, and tokens stay on the server.
Alerts that save money
- A campaign spent more than X with zero backend orders in 3 days.
- CPC rose more than 30% vs its 2-week average.
- Daily spend exceeded plan by 50%.
- An account stopped spending (payment failed, ads rejected).
These alerts work well in chat (automated reports).
Common mistakes
- Adding up platform conversions and calling them sales.
- Not reloading history, so last week's numbers drift.
- Ignoring account currency and time zone.
- Not normalising campaign names.
- No link to the backend, so the report only shows how the platforms grade themselves.
Checklist
- One schema for all platforms
- Currency and time zone aligned
- Last 7–30 days reloaded on every run
- Backend orders and revenue next to platform numbers
- MER on the overview
- Alerts for spend without results
- Read-only API access
Step by step: the unified spend table
Everything in a cross-channel report rests on one table: spend and platform metrics per day, platform, campaign, in one currency and one time zone.
- Pull daily campaign stats from each platform's API or a managed connector: date, campaign ID, campaign name, spend, impressions, clicks, platform conversions and value.
- Re-pull the last few days on every run. Platforms restate recent days as late conversions and invalid-click adjustments arrive.
- Convert currency at a documented daily rate, keeping the original amount.
- Align time zones. Each ad account has its own. Note it per account and convert to the business time zone where needed.
- Map campaigns to your channel taxonomy with a lookup table (platform + campaign → channel, objective, product line).
CREATE OR REPLACE VIEW mart.ad_spend_unified AS
SELECT day, 'google_ads' AS platform, campaign_id, campaign_name,
       cost_micros / 1e6 AS spend, impressions, clicks, conversions AS platform_conv, conversions_value AS platform_value, currency
FROM clean.google_ads_campaign_daily
UNION ALL
SELECT day, 'meta', campaign_id, campaign_name,
       spend, impressions, clicks, purchases, purchase_value, currency
FROM clean.meta_campaign_daily
UNION ALL
SELECT day, 'tiktok', campaign_id, campaign_name,
       spend, impressions, clicks, complete_payment, complete_payment_value, currency
FROM clean.tiktok_campaign_daily;
Column names differ between platforms and API versions, so check them against your connector. The point is one shape for all.
Worked example: platform claims vs backend reality
Illustrative month, three platforms:
| Platform | Spend | Platform-reported conversions | Platform ROAS | Backend orders (UTM/click ID) | Backend ROAS |
|---|---|---|---|---|---|
| Google Ads | 120,000 | 410 | 4.6 | 360 | 3.9 |
| Meta | 150,000 | 520 | 4.1 | 300 | 2.3 |
| TikTok | 60,000 | 190 | 3.8 | 85 | 1.6 |
| Sum | 330,000 | 1,120 | — | 745 | 2.8 |
| Backend total paid orders in month | 980 |
The platforms together claim 1,120 conversions in a month with 980 real orders, of which 235 came from non-paid channels. Each platform counts its own view-throughs and longer windows and takes credit for overlapping customers. Neither column is "the truth". Platform columns are useful within a platform for optimisation, and the backend column is the one for budget allocation across platforms. Show both, labelled. More on why in the attribution guide.
A budget pacing view
For anyone managing monthly budgets, a pacing table prevents both overspend and money left on the table:
| Platform | Monthly budget | Spent to date (day 16 of 31) | Expected at this point | Pace |
|---|---|---|---|---|
| Google Ads | 120,000 | 66,000 | 61,900 | 107% |
| Meta | 150,000 | 63,000 | 77,400 | 81% |
| TikTok | 60,000 | 31,500 | 31,000 | 102% |
Expected = budget × days passed / days in month (or weighted by your weekday pattern). A pace below 90% or above 110% is worth a look. Show it in the daily Telegram report for whoever owns the budgets.
A common trap: campaign names change
Marketers rename campaigns, and a lookup table keyed on names silently stops matching. Key the mapping on campaign ID and use the name only for display. List new IDs without a mapping in the weekly check, so no campaign falls into "other" unnoticed.
The same applies to UTMs. If campaign names in links are typed by hand, they drift from the platform names within weeks. Generate UTMs from the campaign ID or a template in the builder sheet, and join backend orders to spend on that key, not on a free-text name.
Finally, review the mapping table monthly with the marketer. Ten minutes spent assigning new campaigns to channels and objectives keeps the whole report trustworthy.
FAQ
Can I build this in Looker Studio?
Yes. Google Ads connects natively, and Meta and TikTok need connectors. Do the backend join and the normalisation in a warehouse, then point Looker Studio at the finished tables.
How often should ad data refresh?
Daily is enough for reporting. For alerts on large budgets, go hourly.
Why do yesterday's numbers change today?
Platforms add late conversions and adjust spend after the fact. That's why the pipeline reloads recent days.
Can I add Google Search Console?
Yes, as a separate "organic" block with impressions, clicks and positions by query, next to paid search.

DATUMPANEL — Business data analytics
DATUMPANEL is an independent data analyst based in Ukraine. I build dashboards for business owners, set up GA4 and the BigQuery export, and run data pipelines and Telegram auto-reports for e-commerce, service businesses, SaaS and agencies, from data audit to decisions.