Skip to content

Solution example · For SaaS and mobile apps

MRR, churn and app quality — no spreadsheets required.

I turn payments, product events and crashes into metrics the whole team trusts — from the CEO to the engineers.

SaaS & appsDesign: Classic
MRR$48.2K5.3%
Active users12.8K3.9%
Churn2.1%0.4 pp
Trial → paid18.5%2.2 pp
Weekly MRR · $This periodPrevious period

ExplainedChurn dropped after the onboarding tour launched: users reach their “aha” moment two days sooner.

Sources
StripeMixpanelCrashlyticsPostgreSQL
Which cohort churns fastest?
AI agentThe March cohort on Basic churns fastest: 31% cancel before day 30. Cause: most never connected an integration. Recommendation: add an integration step to onboarding.
DATUMPANEL· TelegramnowDaily digestMRR: $48.2k (+5.3%)⚠ 3 new crashes on Android 14
Try a design · or get a unique style built for your brand
01Call30 min
02Accessread-only
03First versionyour data
04Supportweekly

SaaS & apps

Sound familiar?

  1. 01

    Everyone has their own MRR

    Finance, product and marketing all calculate it differently and argue in meetings.

  2. 02

    Churn shows up too late

    The user has already left, though the signals were in the data weeks earlier.

  3. 03

    Crashes live apart from the business

    Nobody sees how much revenue a new Android bug is costing.

Solution example

What the dashboard shows

A starting set of metrics for this industry. We finalise the list during the audit.

MRR / ARR
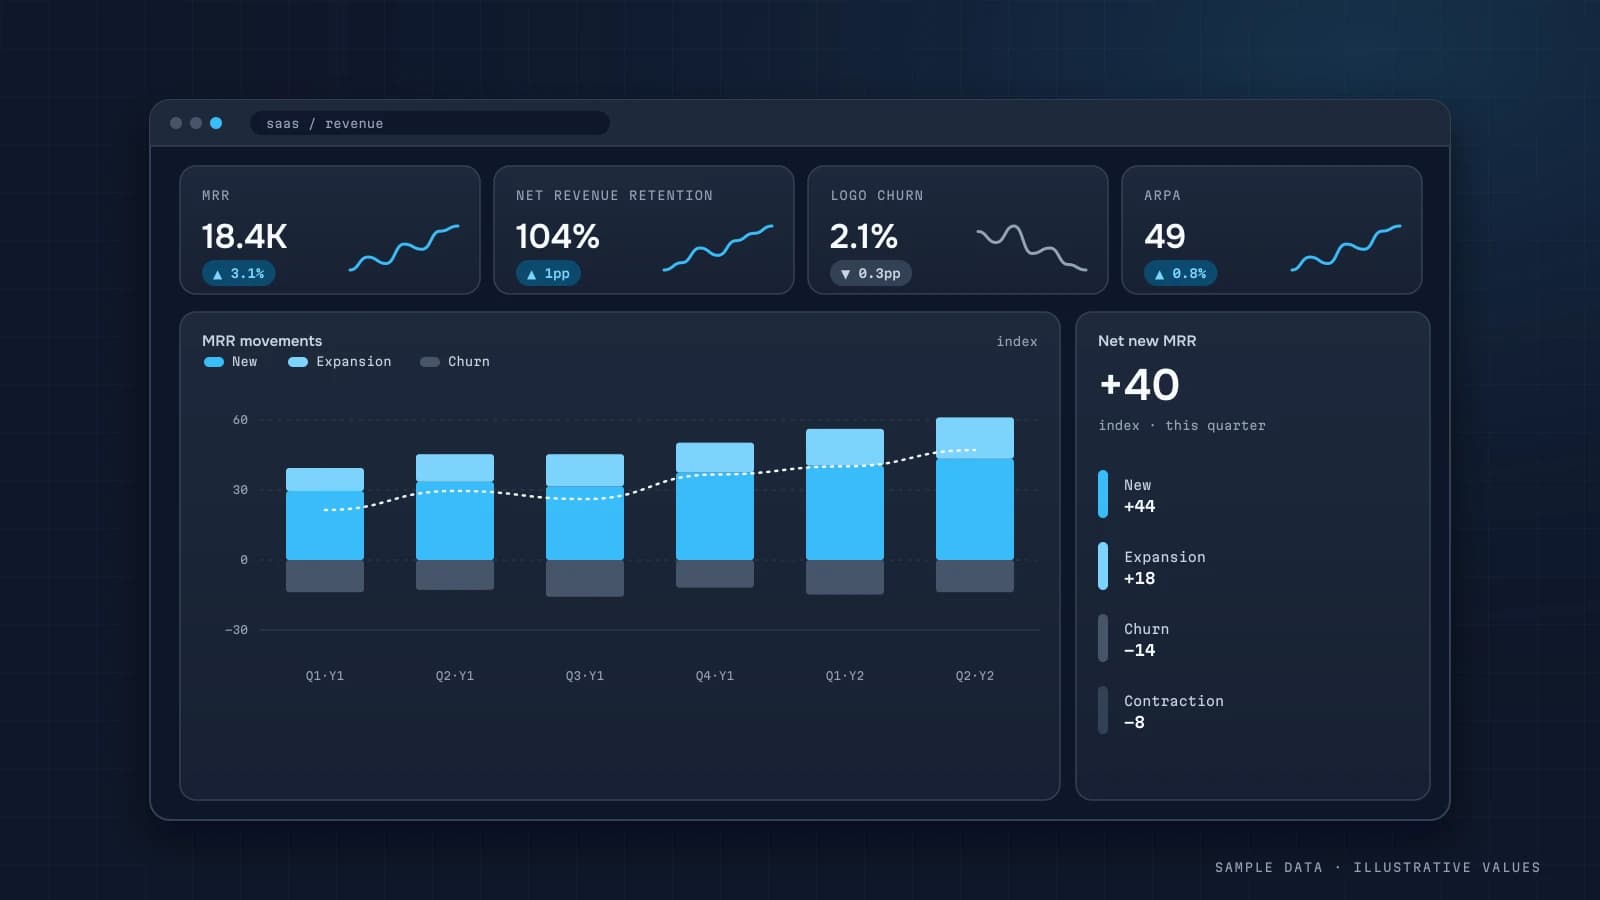
new, expansion, churned
DAU / MAU
activity and stickiness
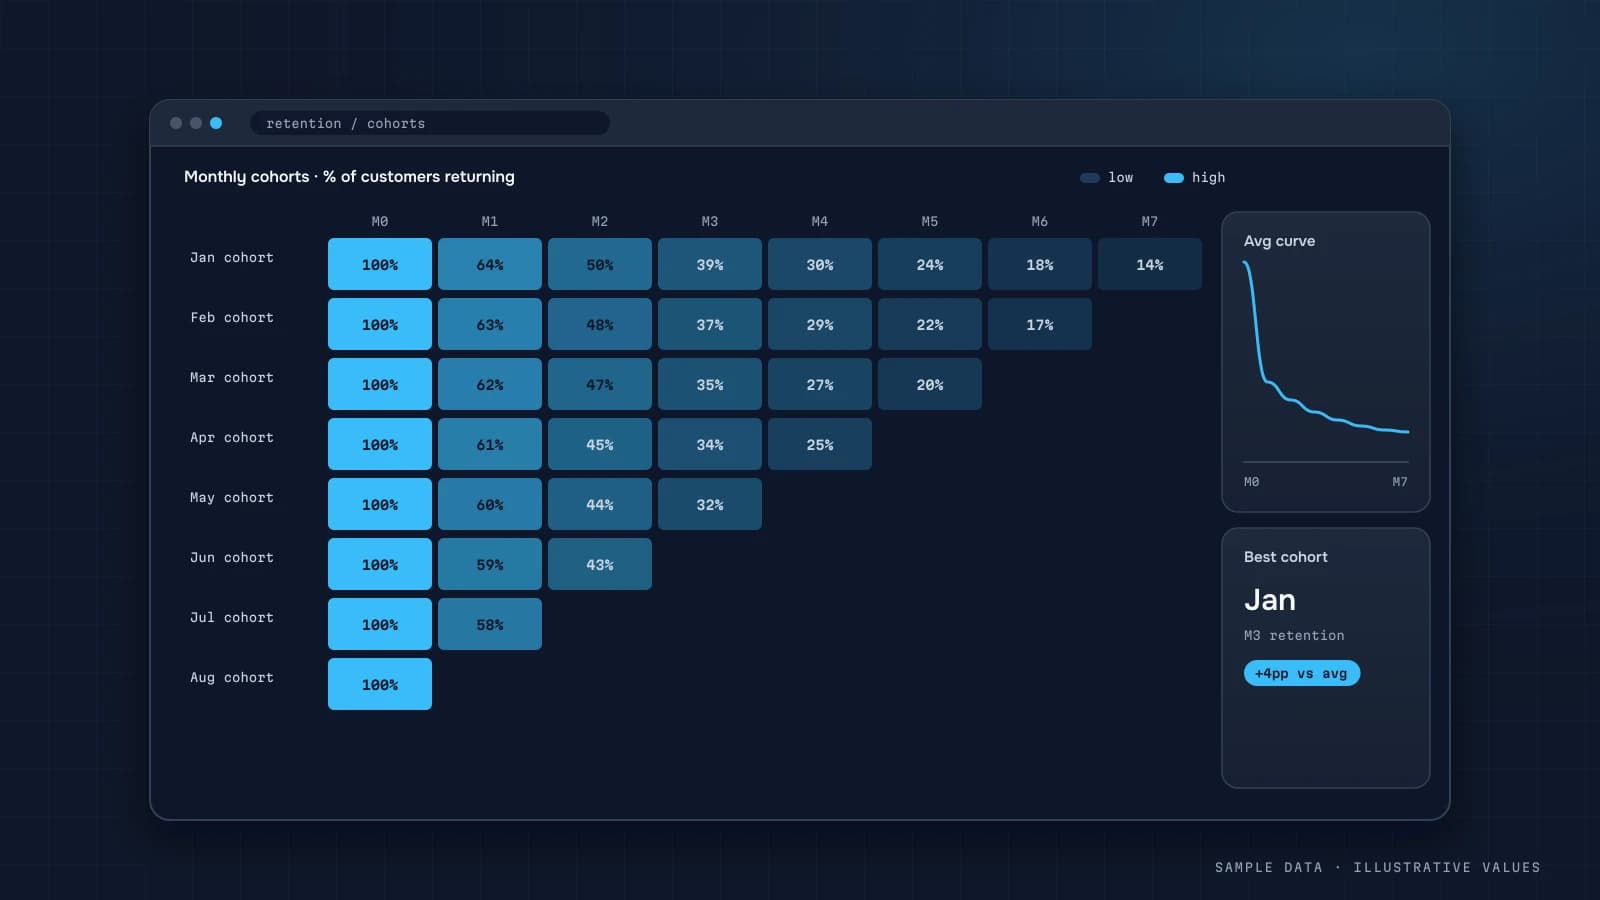
Retention cohorts
by sign-up month and plan
Trial → paid
conversion and time to pay
Screen paths
a Sankey of screen-to-screen flows
Crashes
crash-free users, top issues

Solution example

Who gets what

  • CEO

    «Are we growing or flat?»

    A weekly MRR breakdown: new, expansion and churn.

  • Product manager

    «Where do users drop off during onboarding?»

    Screen analytics: paths, a Sankey and exit points.

  • Engineer

    «What should we fix first?»

    Top crashes with the number of users affected and platforms.

Workspace sections you’ll use here

  • Overview

    Headline KPIs compared with the previous period, plus trends.

  • Users

    DAU, sessions, sign-ups and audience activity.

  • Screen analytics

    User paths between app screens, a Sankey diagram and a screen table.

  • Devices & platforms

    iOS / Android / web, device models and audience split.

  • Crashes

    Firebase Crashlytics: crash trend, top issues, platforms and affected users.

  • AI assistant

    Answers questions about your metrics and explains changes in plain language.

Scenario

A B2B SaaS with a mobile app

Before

MRR came from a spreadsheet of Stripe exports, product looked at Mixpanel, engineers at Crashlytics. Monthly numbers never matched.

After

One model in BigQuery: MRR movements, cohorts by plan, and crashes weighted by the paying users they hit.

Result

Typical effect: churn is visible 2–3 weeks earlier and bugs are prioritised by revenue.

A generalised scenario based on typical projects; impact depends on your data.

Sample AI-agent insight

«Which cohort churns fastest?»

The March cohort on Basic churns fastest: 31% cancel before day 30. Cause: most never connected an integration. Recommendation: add an integration step to onboarding.

Sample Telegram report

Daily digest

MRR: $48.2k (+5.3%)

⚠ 3 new crashes on Android 14

Typical sources:

  • Stripe / Paddle
  • Mixpanel / Amplitude
  • Firebase / Crashlytics
  • BigQuery
  • PostgreSQL
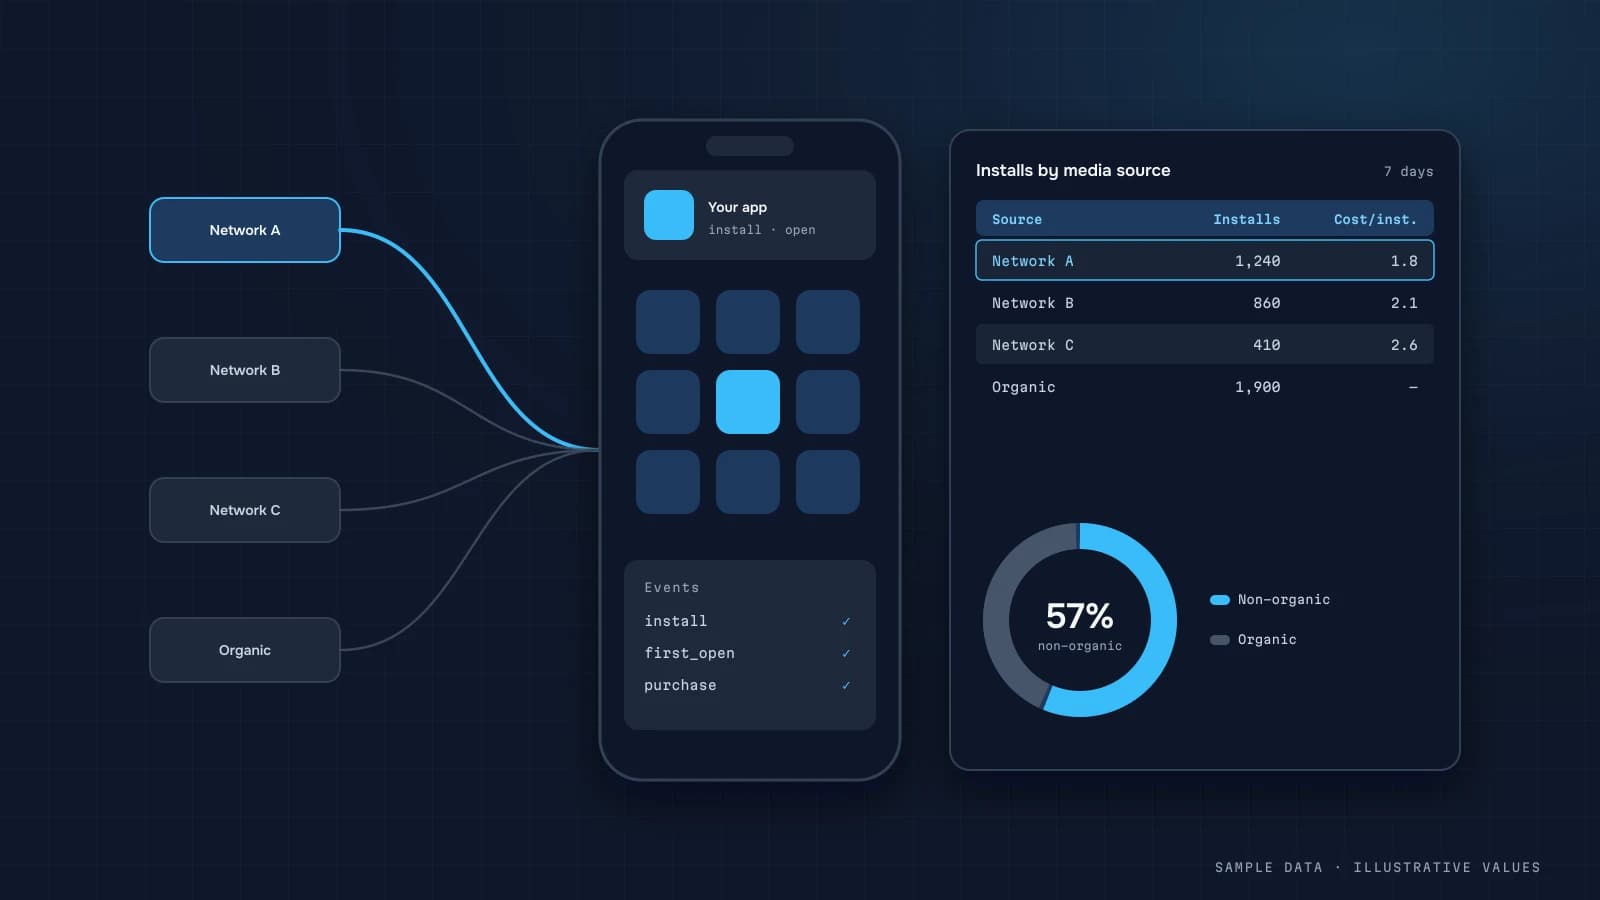
  • AppsFlyer

Plans

Three ways to get started

Start with a micro-dashboard on your spreadsheets, a ready-made template for this industry, or analytics built entirely around your processes.

01Timeline: 1–2 weeks

Lowest-cost start

Micro-dashboard

A static report from your existing data and spreadsheets (Excel, Google Sheets, CSV or a database) — hosted on GitHub Pages or Vercel. A strong fit for entrepreneurs, sole traders and individuals.

  • Excel, CSV or Google Sheets as input
  • 1–3 screens with key charts
  • Static hosting — near-zero running cost
  • Updates on request or on a schedule
02Timeline: 2–4 weeks

Ready-made dashboard

A proven template for your industry, connected to your own data.

  • The key metrics for your industry
  • Plain-language notes on every metric
  • Reports in Telegram
  • Six designs to choose from
03Timeline: 4–8 weeks

Done-for-you analytics

Reports, models and ongoing support built around your questions.

  • Data and metrics audit
  • Any source or API
  • An AI agent trained on your data
  • Regular insights from an analyst

FAQ

The short version

Do you support Firebase and BigQuery?

Yes — I connect the GA4/Firebase BigQuery export and Crashlytics for your project.

What about Stripe, Mixpanel or Amplitude?

I connect them per project via API — I’ll scope it on the first call.

Can metrics be embedded in our product?

Let’s discuss that as part of done-for-you analytics.

Read more on the blog

All blog articles →

One version of MRR for the whole team.

Tell me about your stack and I’ll show how it would look on your events.

Or reach me directly:

Open the demo →

Send a request

I reply within one business day.

What are you interested in
Industry
A few more details · optional
Approximate budget · optional
When to start · optional
Data sources you have · optional

By submitting, you agree to the Privacy policy — your contact details are used only to reply to this request.