Marketing attribution models: how to measure channels honestly
How attribution models work (last click, first click, linear, data-driven), why Google Ads, Meta and GA4 all report different conversions, and how to build one channel report you can actually trust.
Add up the conversions in Google Ads, Meta Ads Manager and GA4, and the total almost always beats the number of orders in your store. Nobody is lying. Each platform claims the sale under its own rules, and those rules are what attribution is.
This guide covers working out which numbers to trust and building a channel report that's solid enough to move budget on.
What attribution means
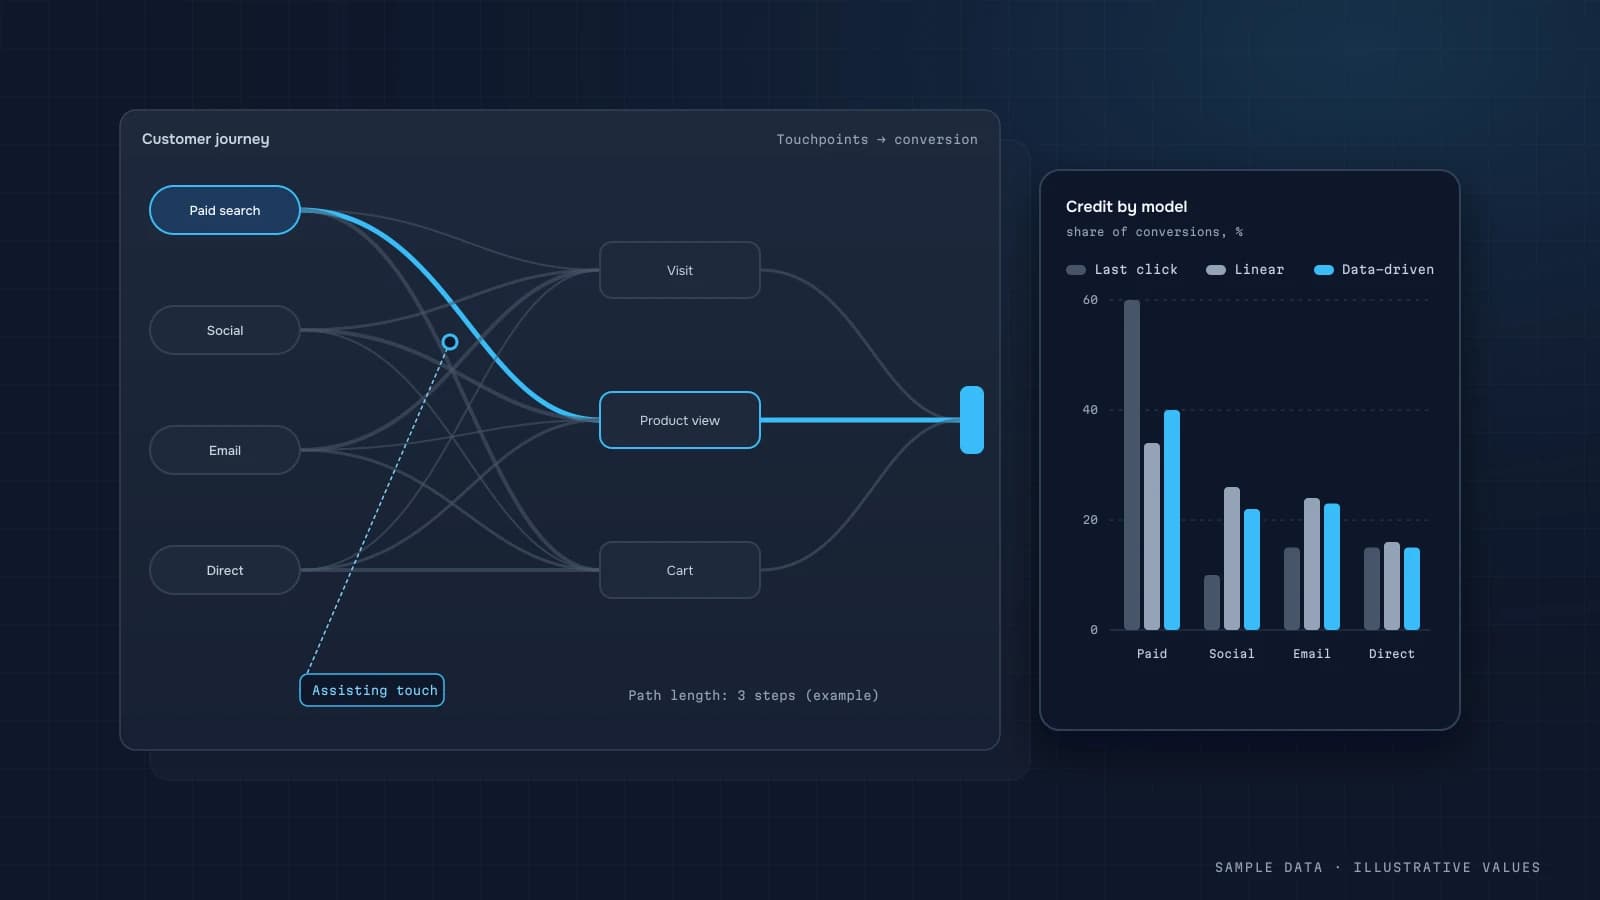
Attribution is how credit for a conversion gets split across touchpoints. A customer might see an Instagram ad, find you on Google a week later and finally buy after an email. Which channel "drove" that sale depends on the model you use.
The main models
| Model | How credit is split | Good for | Watch out |
|---|---|---|---|
| Last click | 100% to the last click | short cycles, search, retargeting | undervalues awareness |
| First click | 100% to the first touch | judging acquisition channels | ignores what closed the deal |
| Linear | equal across touches | seeing each channel's role | blurs the signal |
| Time decay | more to recent touches | longer B2B cycles | still a heuristic |
| Position-based | 40/20/40 first/middle/last | balancing acquisition and closing | arbitrary weights |
| Data-driven | an algorithm on your data | high conversion volume | black box, needs volume |
GA4 uses data-driven attribution by default in its attribution reports. The rules and the available models are documented in Google's help center. Google has also retired several rule-based models over time, so an old report and a new one may be using different logic.
Why every platform shows a different number
The reasons stack on top of each other:
- Different models. Google Ads and Meta credit themselves when there's a click, or, for Meta, a view within the window.
- Different windows. For example, 7-day click / 1-day view in one platform versus 30 days in another.
- Different dates. Ad platforms often record the conversion on the click date. Your store records it on the payment date.
- Modelling. With consent mode and tracking limits, platforms model part of the conversions (consent mode explained).
- View-through. Meta counts view-through conversions. GA4 can't see them.
So: use ad platforms to optimise within a channel, and use your own single model to allocate budget across channels.
How I build first-party attribution
Step 1: one source of truth for sales
Orders and revenue come from the store backend or CRM (Shopify, Stripe, HubSpot), not from GA4. Every order has an ID, a date, an amount and a status (paid or refunded).
Step 2: connect orders to visits
The robust approach is to send transaction_id with the GA4 purchase event and to store UTMs and gclid/fbclid on the lead or order. Then orders can be joined to sessions in BigQuery (GA4 BigQuery export).
Step 3: normalise sources
Attribution fails without UTM discipline. facebook, fb, Facebook and meta show up as four channels instead of one. See the UTM naming convention.
Step 4: show several models side by side
I nearly always put two or three models in one table. The gap between them tells you something on its own.
| Channel | Last-click orders | First-click orders | Spend | ROAS (last) | ROAS (first) |
|---|---|---|---|---|---|
| Google Search | 120 | 70 | ~$4,000 | high | medium |
| Meta prospecting | 30 | 95 | ~$4,500 | low | high |
| 80 | 10 | $300 | very high | low |
Illustrative numbers. This is the typical pattern: Meta brings in new people, and search and email close them. Cut Meta for its weak last-click ROAS and a few weeks later search starts to drop too.
Step 5: validate with experiments
No model proves causation. For big decisions, run incrementality tests: switch a channel off in some regions and compare against a holdout, or use the geo-lift and conversion-lift studies the ad platforms offer.
Attribution for mobile apps
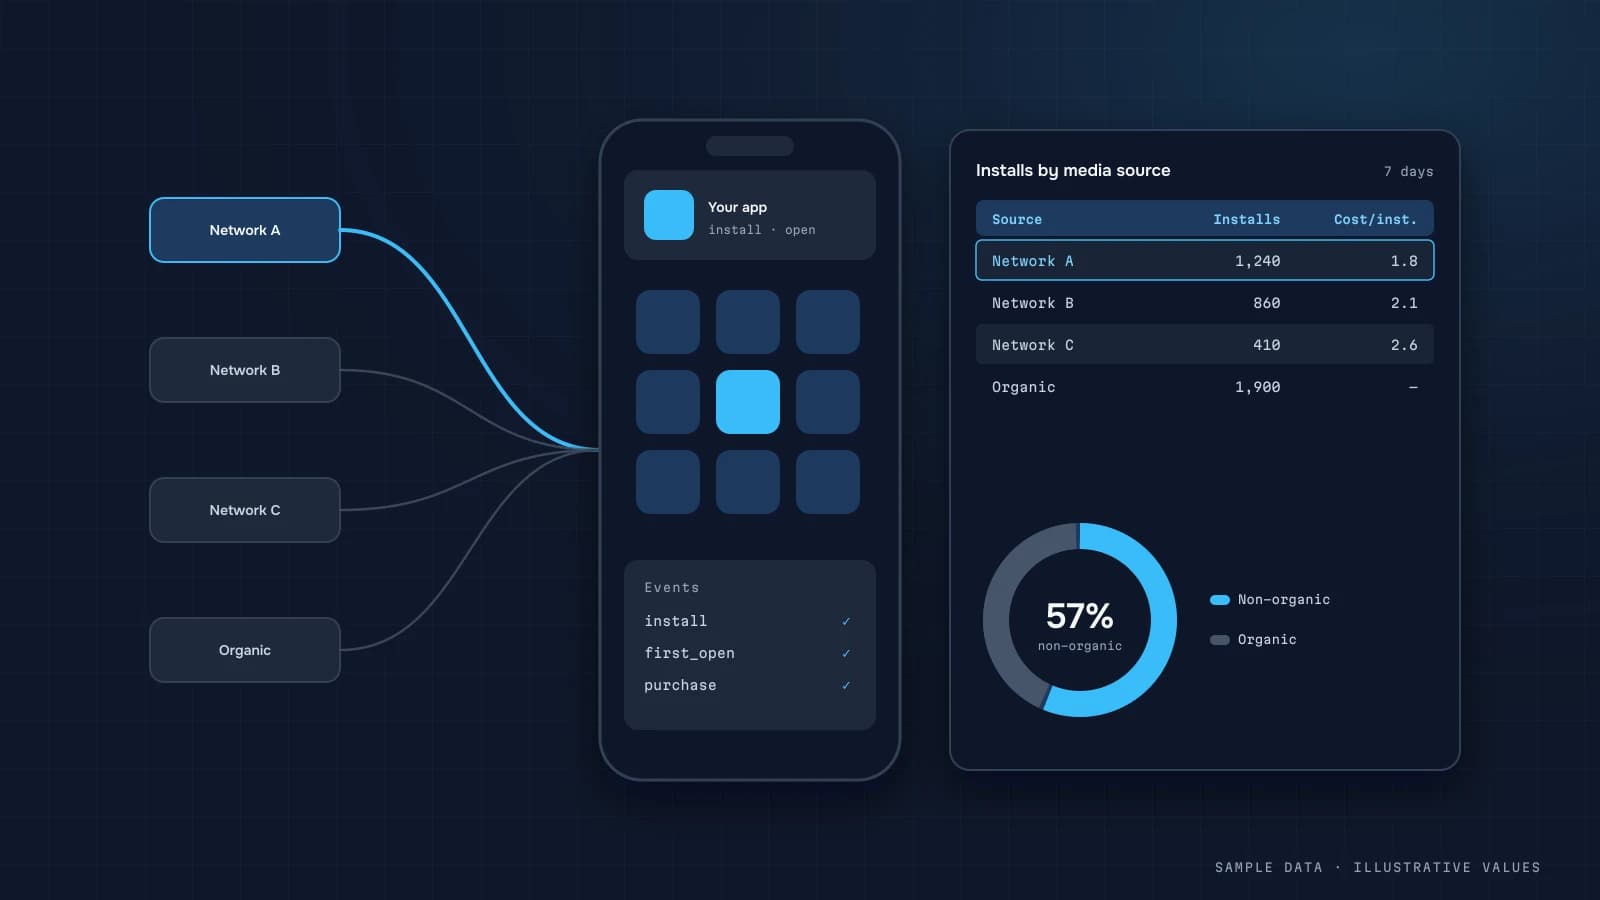
For apps, the install source is decided by an MMP such as AppsFlyer. MMPs have their own windows and their own rules for iOS after ATT and SKAdNetwork. Connecting that to revenue and in-app behaviour is covered in AppsFlyer attribution.
Putting attribution on a dashboard
- One "Channels" view: spend, plus orders and revenue from your backend under the selected model, plus ROAS/CAC.
- A model switcher: last click, first click, linear.
- An explicit "Unattributed" row. Don't hide it. Its share is a tracking-quality metric.
- A note on the attribution window next to the table.
- An 8–12 week trend. Attribution is noisy over a few days.
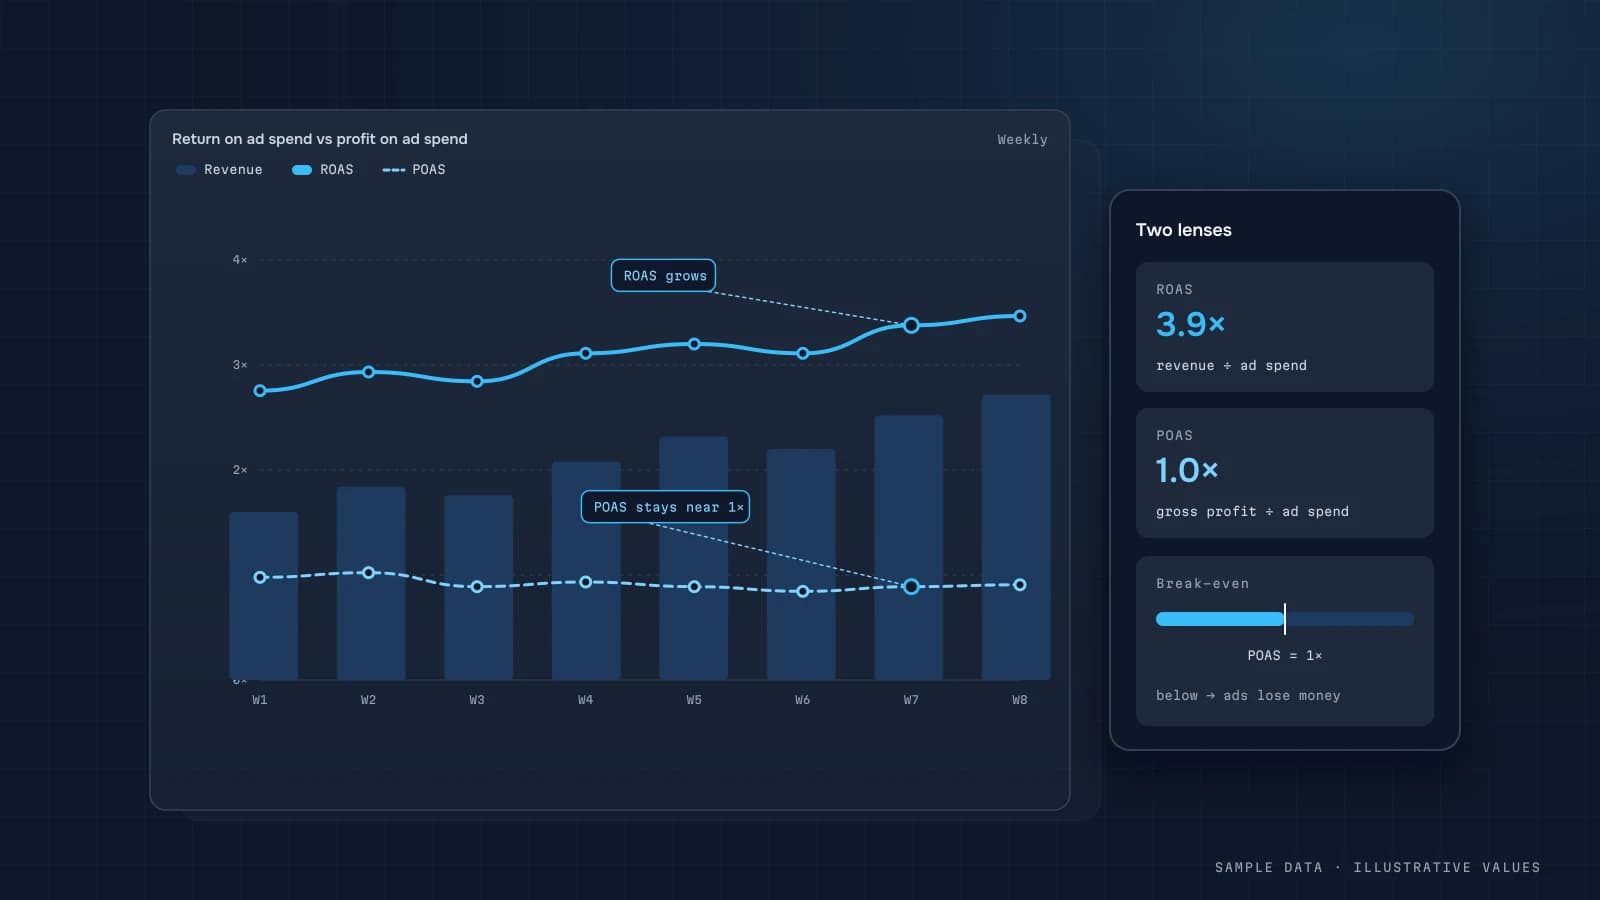
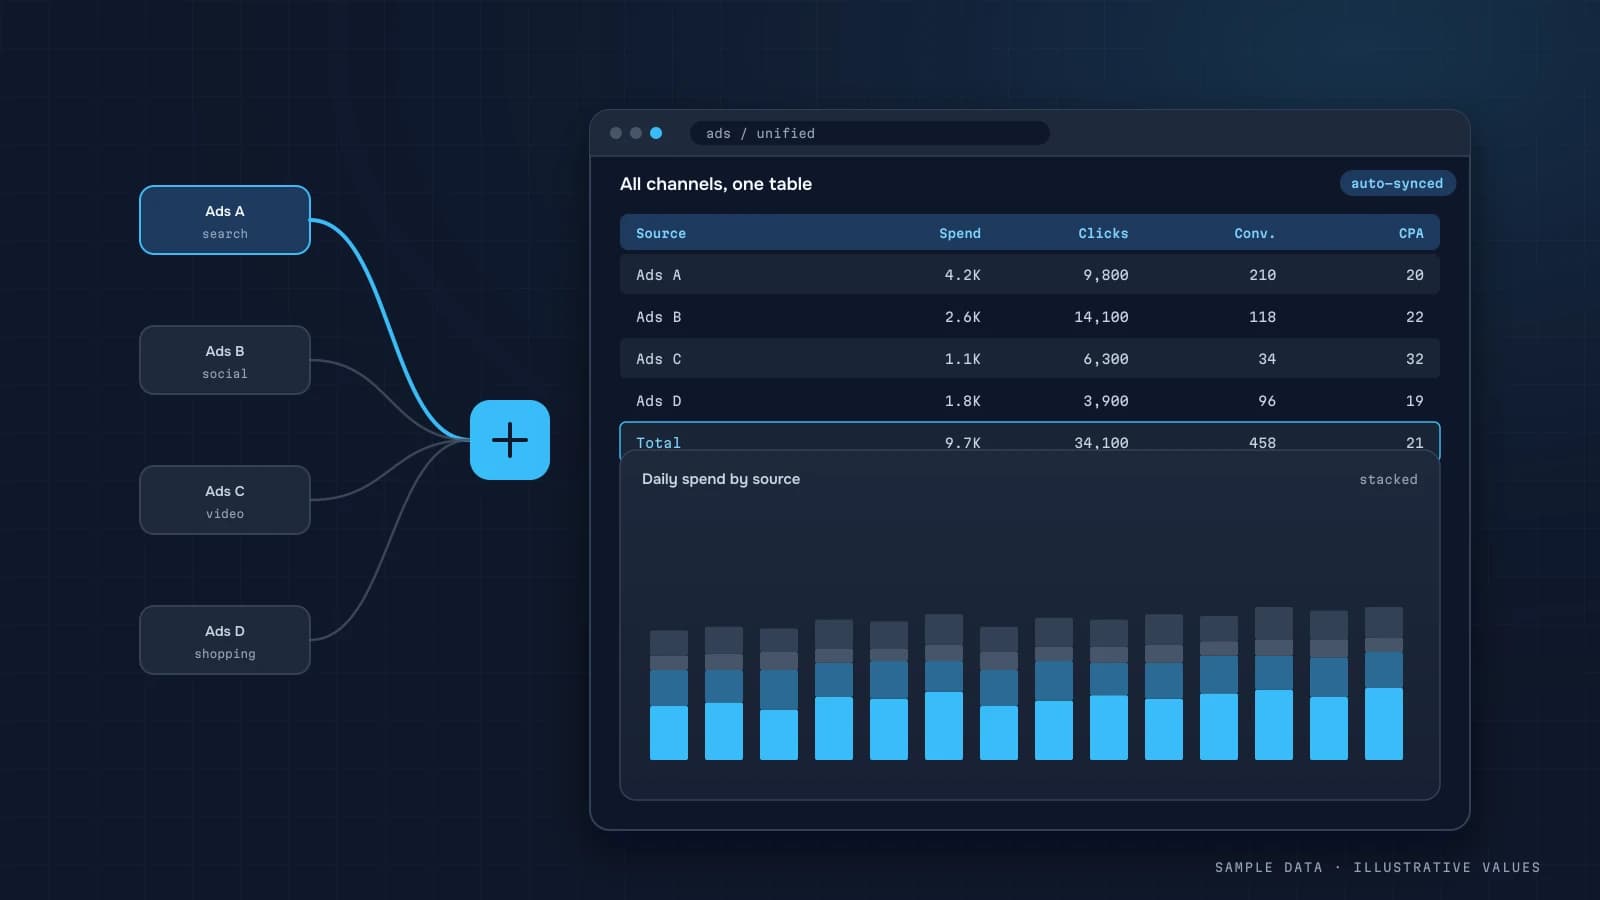
To get Google Ads and Meta spend into one table, see the cross-channel ad reporting dashboard. To move from ROAS to profit, see ROAS vs POAS.
Common mistakes
- Adding up platform conversions and comparing the total with orders.
- Judging top-of-funnel channels on last click.
- Ignoring refunds and cancellations.
- Switching models without noting the date of the switch.
- Drawing conclusions from a single week.
Checklist
- Sales come from the backend or CRM, not ad platforms
transaction_idmatches between GA4 and the backend- UTMs and click IDs are stored with the lead or order
- There's a channel dictionary with normalisation rules
- The report shows 2+ models side by side
- The unattributed share is tracked
- Big budget moves are validated with a test
A worked example: the same sales, three answers
To see why model choice matters, take five illustrative customer journeys that each ended in a 1,000 order:
| Customer | Touchpoints in order |
|---|---|
| A | Meta ad → Google search (brand) → purchase |
| B | Meta ad → email → purchase |
| C | Google search (generic) → purchase |
| D | Meta ad → direct → Google search (brand) → purchase |
| E | TikTok ad → Meta ad → email → purchase |
Credit per channel under three models (direct visits are skipped, as last non-direct click does):
| Channel | Last non-direct click | First click | Linear |
|---|---|---|---|
| Meta | 0 | 3,000 | 500 + 500 + 500 + 333 = 1,833 |
| Google brand | 2,000 | 0 | 500 + 500 = 1,000 |
| Google generic | 1,000 | 1,000 | 1,000 |
| 2,000 | 0 | 500 + 333 = 833 | |
| TikTok | 0 | 1,000 | 333 |
| Total | 5,000 | 5,000 | ~5,000 |
(In the linear model each order's 1,000 is split equally across its non-direct touches: 500/500 for A, B and D, and 333 each for E's three touches. The numbers are rounded.)
With last click, Meta looks worthless and email looks like a star. With first click, Meta brought in most of the revenue. Neither is "true". Brand search and email mostly harvest demand that something else created. The practical conclusion:
- Use one model consistently for week-to-week comparisons. Changing the model changes the numbers more than any campaign does.
- Look at first-touch and last-touch side by side for upper-funnel channels. If a channel is big in first touch and near zero in last touch, it's an introducer, and cutting it will slowly shrink everything downstream.
- Treat brand search separately. It's closer to "direct with a detour" than to a prospecting channel.
SQL: last non-direct click from your own data
If you have sessions with source and a customer or user ID (for example from the GA4 BigQuery export joined to orders), last non-direct click is a window function:
WITH touches AS (
  SELECT o.order_id, o.revenue, s.channel, s.session_start,
         ROW_NUMBER() OVER (PARTITION BY o.order_id ORDER BY s.session_start DESC) AS rn
  FROM orders o
  JOIN sessions s
    ON s.user_id = o.user_id
   AND s.session_start <= o.created_at
   AND s.session_start >= TIMESTAMP_SUB(o.created_at, INTERVAL 30 DAY)
  WHERE s.channel <> 'direct'
)
SELECT channel, COUNT(*) AS orders, SUM(revenue) AS revenue
FROM touches
WHERE rn = 1
GROUP BY channel
ORDER BY revenue DESC;
Swap DESC for ASC in the window to get first click. Orders that had only direct sessions drop out of this query. Add them back as "direct" with a LEFT JOIN, or your totals won't match revenue. The 30-day lookback is a choice; write it in your metric definitions.
Testing incrementality instead of arguing about models
Every model splits credit. None of them answers "what would we lose if we turned this off?" That takes an experiment. Three approaches a small team can actually run:
- Geo holdout. Pause a channel in one or more regions for 3–4 weeks and compare the trend there against similar regions where it kept running. It works best when you sell across many comparable regions.
- Platform lift studies. Meta and Google offer conversion lift tests that randomly withhold ads from a control group (eligibility depends on spend and account setup). Their results are about that platform only, but the method is sound.
- On/off periods. The crudest option is switching a channel off for a few weeks and watching total new customers and revenue, not platform-reported conversions. It's noisy and affected by seasonality, so only trust large effects.
When a test shows a channel is mostly non-incremental (for example brand search where you rank first organically anyway), that's often the single largest budget saving available.
Choosing an approach by business stage
| Stage | What to do |
|---|---|
| Few channels, small spend | consistent last non-direct click in GA4 plus CRM revenue, reviewed monthly |
| Several paid channels | first-party attribution in a warehouse, first vs last touch side by side, margin instead of revenue (POAS) |
| Significant spend across platforms | add regular incrementality tests; consider marketing mix modelling once you have 2+ years of weekly data |
The goal isn't a perfect model. It's a stable, documented way of comparing channels, plus periodic tests that keep the model honest.
Attribution windows: the setting nobody writes down
Every number in an ad platform depends on its attribution window: how many days after a click (or a view) a conversion still counts. Two campaigns compared under different windows aren't comparable, and the defaults differ between platforms and change over time. Before you compare anything:
- Write down the click and view windows configured in each ad account
- Note whether view-through conversions are included in the column you report
- Use the same lookback in your own warehouse attribution (for example 30 days of clicks)
- Record the date whenever a window changes, so a jump in the chart has an explanation
A practical rule: in your own reports, count click-based conversions with a fixed window and show view-through separately, if at all. View-through numbers are the easiest to inflate and the hardest to verify.
Reporting cadence
Attribution numbers are noisy day to day, especially with longer purchase cycles. For budget decisions, I use weekly numbers with a 4-week rolling view and only react to changes that persist for two or more weeks. Daily attribution views are useful for spotting broken tracking, not for moving money.
FAQ
Which attribution model is best?
None is best everywhere. For day-to-day optimisation, the platforms' last-click or data-driven numbers are fine. For splitting budget across channels, compare several models and confirm with experiments.
Why does Meta report more conversions than GA4?
Meta counts conversions after an ad view with no click, uses its own windows and models some events. GA4 can't see those views.
Do I need BigQuery for attribution?
Not for basic reports. For a first-party model that joins backend orders to GA4 sessions, a warehouse like BigQuery is close to essential.
What should I do about unattributed traffic?
First shrink it. Check your UTMs, look for redirects that strip parameters, and look at third-party payment pages that replace the referrer. Show whatever remains as its own row.

DATUMPANEL — Business data analytics
DATUMPANEL is an independent data analyst based in Ukraine. I build dashboards for business owners, set up GA4 and the BigQuery export, and run data pipelines and Telegram auto-reports for e-commerce, service businesses, SaaS and agencies, from data audit to decisions.