Ecommerce dashboard: what to show and how to build it
How to structure an ecommerce dashboard for Shopify, WooCommerce or a custom store, with overview, marketing, product and customer views, the data sources behind them, and a daily KPI digest.
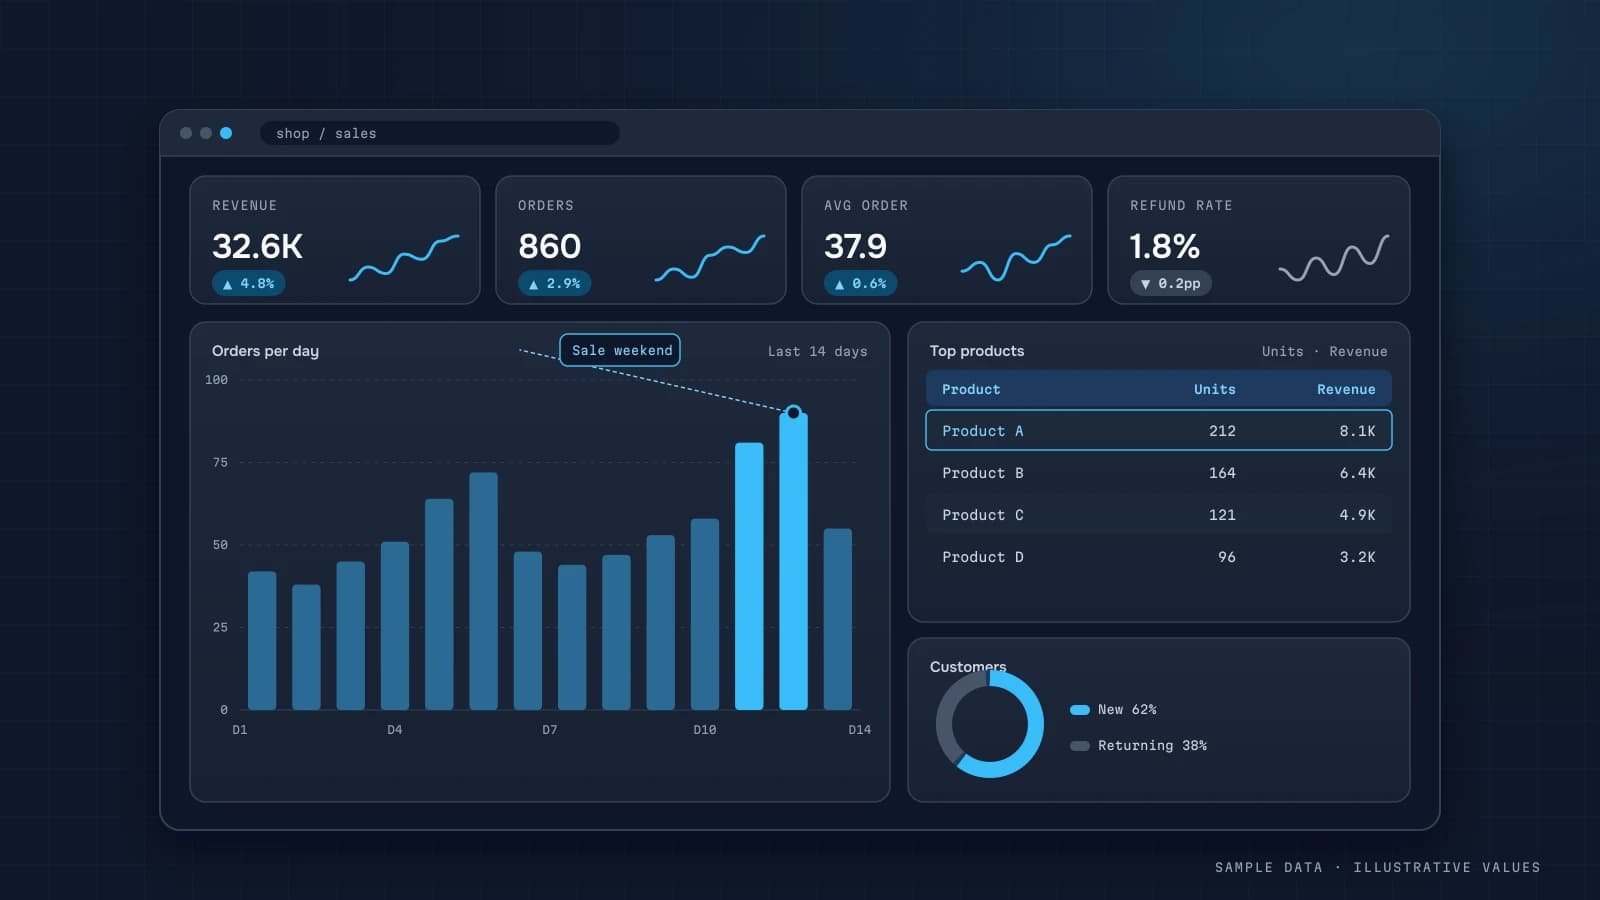
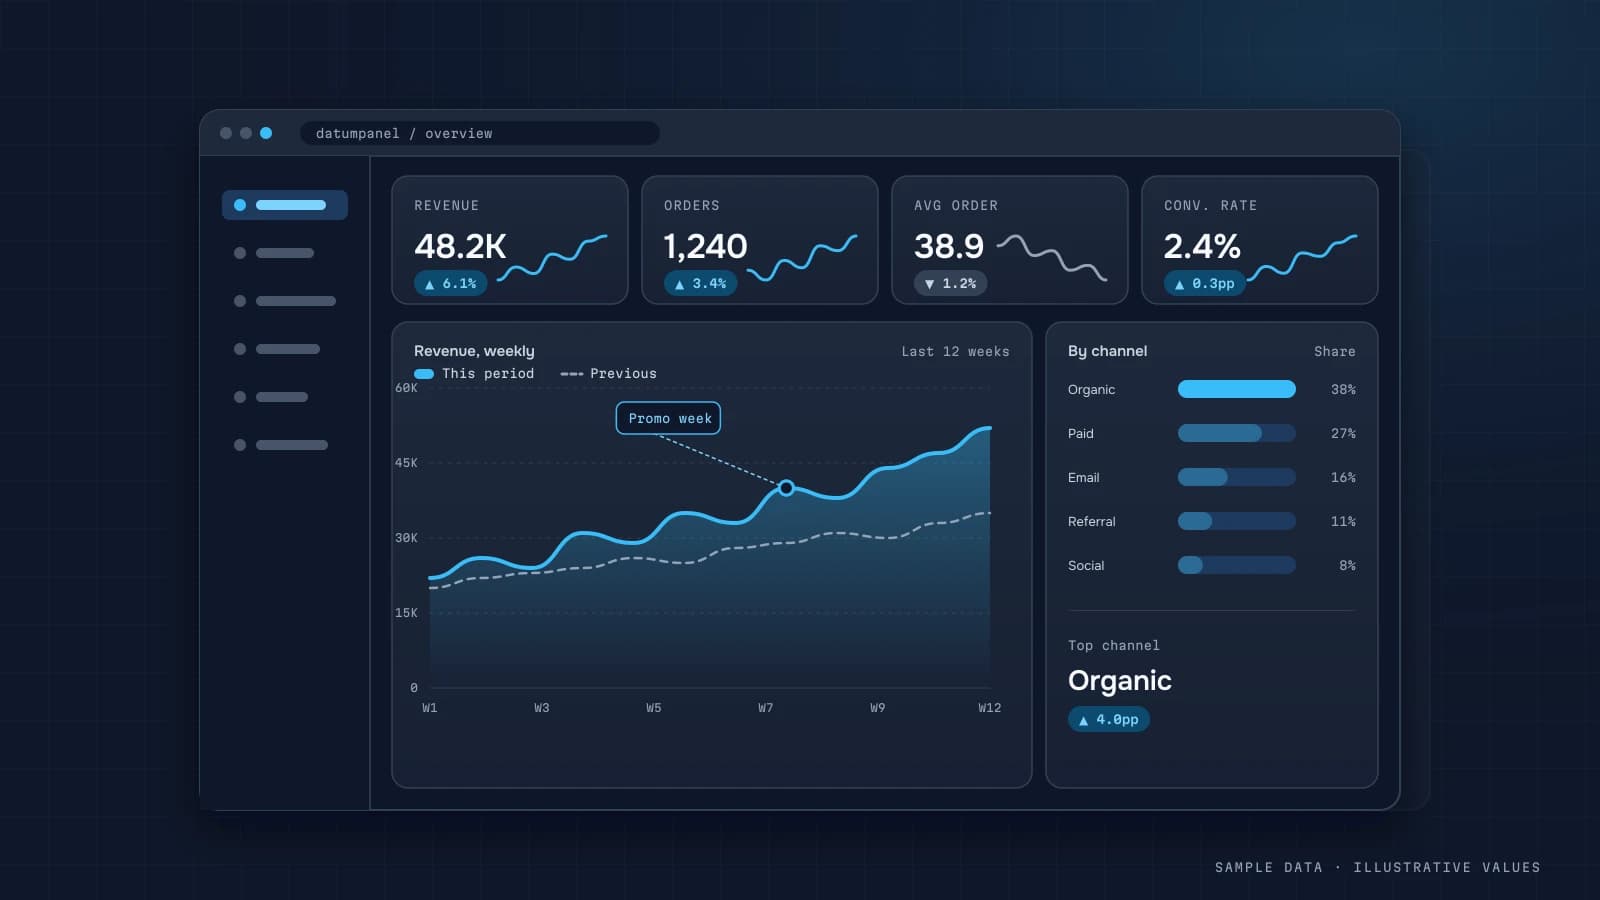
An online store owner opens five tabs every morning: the store admin, the email tool, two ad platforms and GA4, plus a spreadsheet with COGS. An ecommerce dashboard exists so that "how did we do yesterday?" takes one minute instead of an hour.
This is the structure I use for stores: the views, the metrics on each one and where the data comes from.
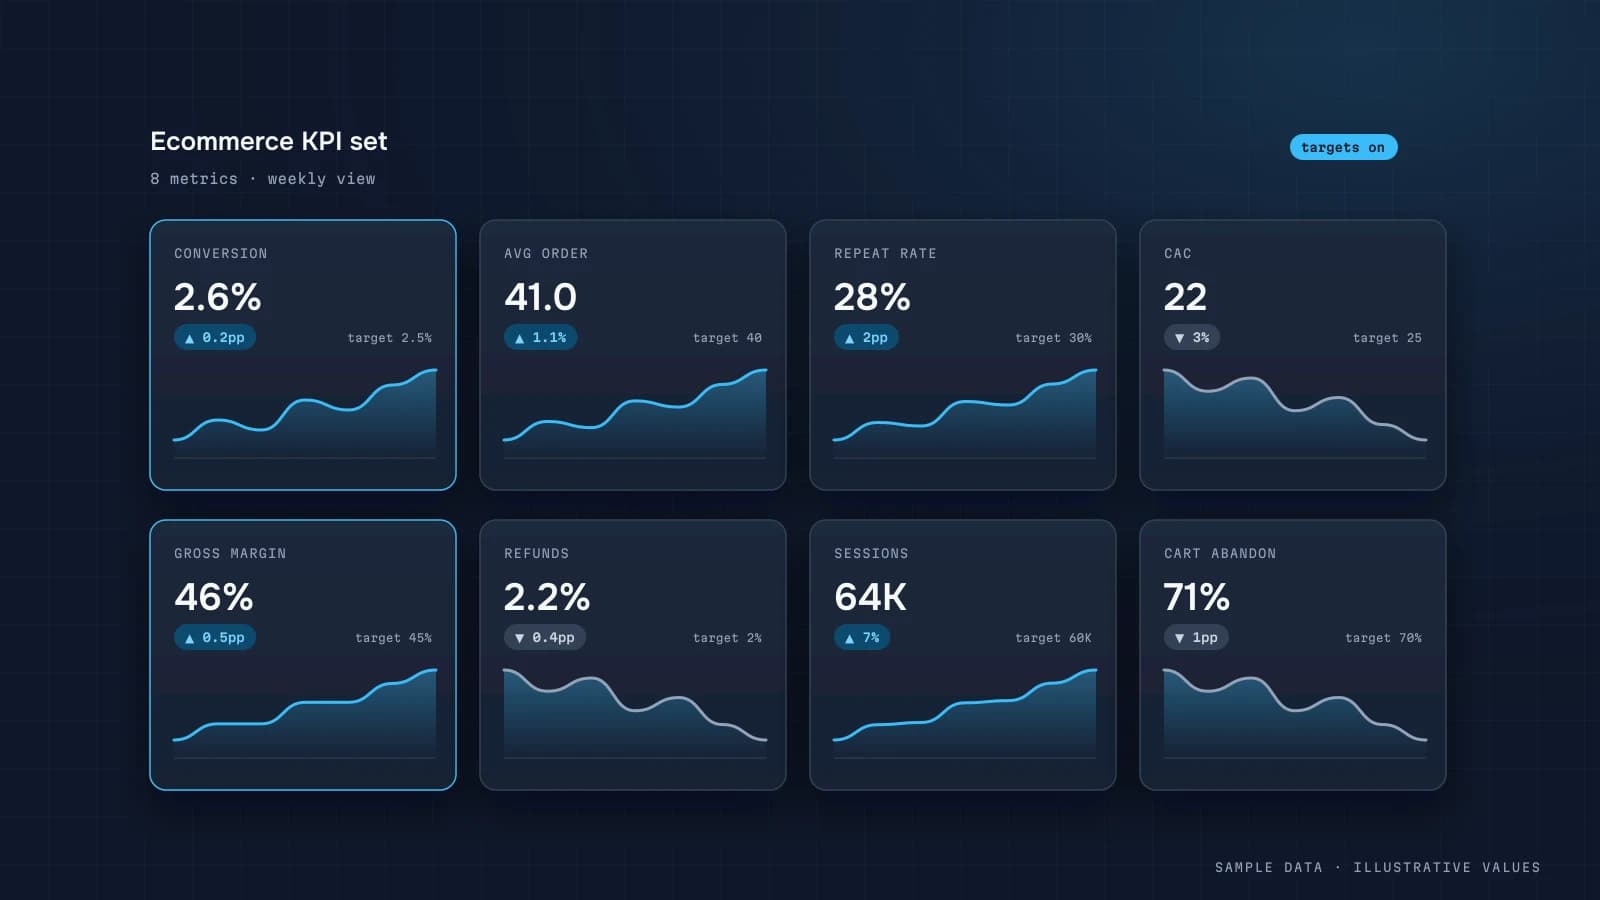
Four views instead of forty widgets
| View | Core question | Audience |
|---|---|---|
| Overview | how did we do yesterday / this week? | founder |
| Marketing | which channels pay for themselves? | marketer |
| Products | what sells, what sits, what's running out? | merchandiser, buying |
| Customers | do buyers come back? | founder, retention marketer |
1. Overview
- revenue (paid orders, net of refunds);
- orders and AOV;
- conversion rate (orders / sessions);
- contribution after ad spend;
- ROAS or MER (revenue / total ad spend).
Compare every KPI with last week and with the same weekday, because stores have strong weekly seasonality.
2. Marketing
- spend, clicks and CPC by channel (Google Ads, Meta, TikTok);
- orders and revenue from the store backend, by source (not from the ad platforms);
- ROAS and CAC by channel;
- the unattributed share of traffic.
The attribution logic is in the attribution guide, and the formulas are in ROAS vs POAS.
3. Products
- top products by revenue and margin, not just units;
- products with lots of views but a poor add-to-cart rate;
- stock levels and stock-out risk for best-sellers;
- returns by product and reason.
4. Customers
- new vs returning buyers;
- the share of revenue from returning customers;
- retention cohorts by first-purchase month (cohort analysis);
- RFM segments for email flows (RFM).
Data sources
| Data | Source |
|---|---|
| Orders, statuses, customers | Shopify, WooCommerce, BigCommerce |
| On-site behaviour, funnel | GA4 → BigQuery |
| Ad spend | Google Ads, Meta Ads, TikTok Ads |
| Payments and fees | Stripe, PayPal, Shopify Payments |
| Shipping costs | carrier APIs or the store backend |
| COGS | inventory system or a sheet |
The rule: money comes from the backend or the payment provider, behaviour comes from GA4. GA4 almost never matches the backend exactly (why GA4 and your CRM disagree).
The store funnel
The standard GA4 funnel is built on the recommended ecommerce events:
| Step | GA4 event |
|---|---|
| Product view | view_item |
| Add to cart | add_to_cart |
| Checkout start | begin_checkout |
| Shipping / payment | add_shipping_info, add_payment_info |
| Purchase | purchase |
The full list and the parameters are in Google's ecommerce docs. How to verify the setup is covered in GA4 ecommerce tracking.
Split the funnel by device on the dashboard. A mobile checkout problem is one of the most common reasons conversion drops.
A daily digest example
DATUMPANEL · Morning summary (yesterday)
Revenue: $4,820 (+9% vs last Tuesday)
Orders: 61 · AOV $79
ROAS (all channels): 4.1
⚠ Mobile conversion −18%: iOS checkout is slower
Illustrative numbers. The digest arrives at 8:00 and links to the relevant view of the dashboard. How to set it up: automated KPI reports.
Build phases
- Tracking audit: do GA4
purchaseevents match backend orders, istransaction_idpassed, are there duplicates? - Connect sources: read-only access plus a pipeline (ETL).
- Data model: one orders table with statuses, COGS and source.
- Views and tooltips for every metric.
- Automated reports and team onboarding.
Realistically that's 2–4 weeks for a proven store template wired to your sources.
Common mistakes
- Taking revenue from GA4 instead of the backend.
- Calculating ROAS on revenue with tax included and refunds left in.
- Ranking products by units instead of margin.
- Not separating new and returning buyers.
- Looking at conversion without a device split.
Checklist
- Revenue comes from the backend, net of refunds
- Same-weekday comparisons
- Spend from all ad channels in one table
- Product-level margin
- Funnel split by device
- New vs returning customers, plus cohorts
- Daily digest in chat
See an example on the ecommerce page, or open the demo.
Step by step: the first version in four weeks
A realistic plan for a store with a shop platform, GA4 and two or three ad channels:
| Week | Work | Result |
|---|---|---|
| 1 | access to all sources, tracking audit, metric definitions agreed | a one-page glossary and a list of tracking fixes |
| 2 | load orders, products, costs and ad spend into a warehouse; daily refresh | clean tables with yesterday's data every morning |
| 3 | the "Overview" and "Marketing" screens; reconciliation with the shop admin | numbers the owner recognises |
| 4 | "Products" and "Customers" screens, morning digest, checks and alerts | the full first version in daily use |
Week 3 is where most of the real work hides. The first time the dashboard shows revenue, someone will say "that's not what the admin shows." Usually they're both right and measure different things (cancelled orders, VAT, shipping included or not). Resolve every such case in the glossary, not by quietly adjusting a formula.
Worked example: reading the overview screen
Illustrative numbers for one week compared with the previous week:
| Metric | This week | Last week | Change |
|---|---|---|---|
| Sessions | 18,000 | 20,000 | −10% |
| Conversion rate | 1.9% | 1.6% | +0.3 pp |
| Orders | 342 | 320 | +7% |
| AOV | 1,150 | 1,200 | −4% |
| Revenue | 393,300 | 384,000 | +2% |
| Ad spend | 70,000 | 80,000 | −13% |
| Contribution margin | 92,000 | 82,000 | +12% |
What this tells an owner in 30 seconds: traffic fell because spend was cut, but conversion rose, so the cut removed low-quality traffic. Revenue held and margin grew. The next question is in the AOV drop: was it a promo, or a shift in which products sell? That's what the Products screen answers.
The important habit: always read revenue as sessions × conversion × AOV. A revenue change with no explanation in those three is usually a tracking problem, not a business one.
SQL: the product performance table
SELECT
  p.sku, p.name, p.category,
  COUNT(DISTINCT li.order_id)                       AS orders,
  SUM(li.qty)                                       AS units,
  SUM(li.line_total_net)                            AS revenue,
  SUM(li.line_total_net - li.qty * c.unit_cost)     AS gross_margin,
  SAFE_DIVIDE(SUM(li.line_total_net - li.qty * c.unit_cost),
              SUM(li.line_total_net))               AS margin_pct,
  SUM(CASE WHEN r.order_line_id IS NOT NULL THEN li.qty END) AS units_returned
FROM order_lines li
JOIN orders o   ON o.order_id = li.order_id AND o.status = 'paid'
JOIN products p ON p.sku = li.sku
JOIN product_costs c ON c.sku = li.sku
 AND o.order_date >= c.valid_from AND (c.valid_to IS NULL OR o.order_date < c.valid_to)
LEFT JOIN returns r ON r.order_line_id = li.id
WHERE o.order_date BETWEEN @from AND @to
GROUP BY 1, 2, 3
ORDER BY gross_margin DESC;
Sort by margin, not revenue. The products that bring in the most revenue and the ones that bring in the most margin are often different lists, and the second one should drive ad budgets and stock decisions.
What the morning digest should include
A short digest beats a dashboard nobody opens. Five lines are enough:
- Yesterday's revenue and orders vs the same weekday last week
- Contribution margin and ad spend
- The biggest mover: the channel or category with the largest change
- Anomalies: tracking gaps, zero-spend campaigns, payment failures
- A link to the dashboard for detail
Two segments worth adding early
Most store-level averages hide two very different groups, so I split them early:
- Mobile vs desktop. Mobile usually brings most of the sessions and a lower conversion rate. If mobile conversion drops while desktop holds, look for a broken checkout step, a slow page or a payment method failing on phones. That's a technical fix, not a marketing one.
- New vs returning customers. A month with strong revenue from returning customers and weak new-customer numbers looks fine today and hurts in three months. Show new-customer orders and CAC next to total revenue so the owner sees both.
Both segments come straight from data you already have (device from GA4, first-order flag from the shop database), so they cost little to add and often answer the first "why" question.
FAQ
Does this work for Shopify stores?
Yes. Shopify's API exposes orders, refunds and products, and GA4 covers on-site behaviour. Shopify's own analytics is a good start but stops at the store's borders: no ad spend from other platforms, no COGS from your systems.
How many sources do I need to start?
At minimum, orders from the store and ad spend. Add GA4 and COGS as the second step.
We don't use a CRM. Is that a problem?
No. The store platform or the payment provider becomes the source of truth.
How quickly does a dashboard pay off?
It depends on the business. The first win is usually spotting a losing campaign, or products that sell at a loss once shipping and ads are counted.

DATUMPANEL — Business data analytics
DATUMPANEL is an independent data analyst based in Ukraine. I build dashboards for business owners, set up GA4 and the BigQuery export, and run data pipelines and Telegram auto-reports for e-commerce, service businesses, SaaS and agencies, from data audit to decisions.