Contribution margin for ecommerce: CM1, CM2, CM3 with an example
How to calculate an online store's contribution margin in three levels (COGS, shipping, returns, payment fees, ad spend) and how to show a revenue-to-profit waterfall on your dashboard.
Revenue isn't the money the business gets to keep. Between revenue and profit sit COGS, shipping, payment fees, returns and ad spend. Contribution margin shows how much each order actually contributes toward fixed costs and profit. Without it, you can't tell which products, channels and promotions are worth it.
Margin levels
It's easiest to calculate in three steps:
| Level | Formula | What it shows |
|---|---|---|
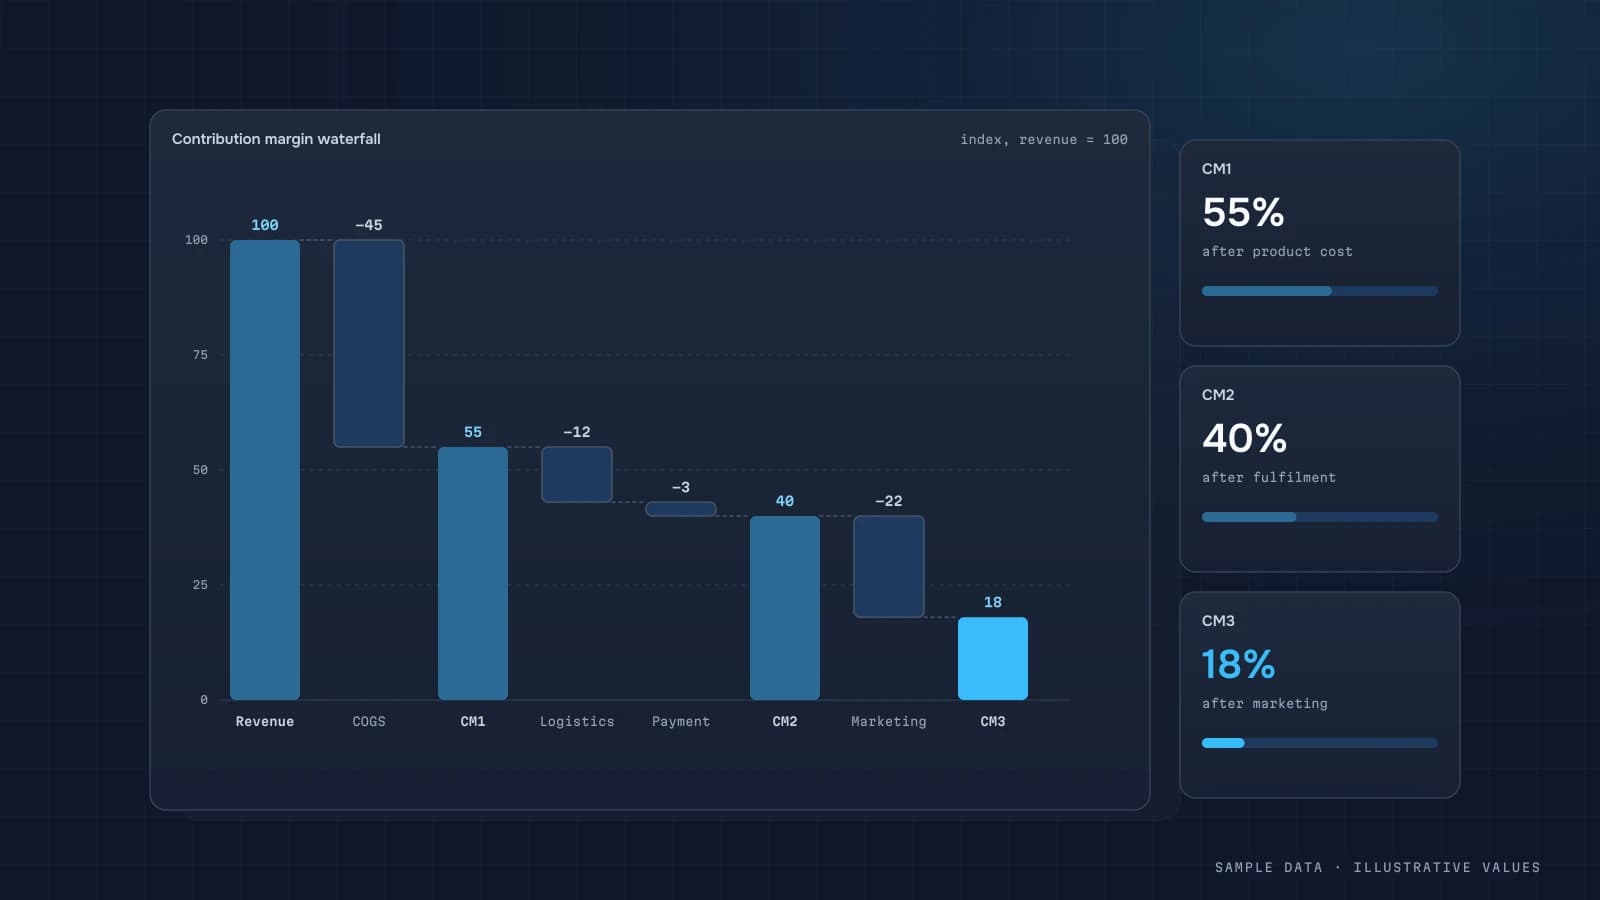
| CM1 | net revenue − COGS | product margin |
| CM2 | CM1 − shipping − packaging − payment fees − returns cost | margin after fulfilment |
| CM3 | CM2 − marketing spend | what's left for fixed costs and profit |
Net revenue excludes sales tax/VAT and is net of discounts and refunds.
A monthly example
Illustrative store data.
| Line | Amount, $ | % of net revenue |
|---|---|---|
| Net revenue | 100,000 | 100% |
| COGS | −52,000 | 52% |
| CM1 | 48,000 | 48% |
| Outbound shipping paid by the store | −5,500 | 5.5% |
| Returns (return shipping, unsellable stock) | −2,500 | 2.5% |
| Packaging | −900 | 0.9% |
| Payment processing fees | −2,900 | 2.9% |
| CM2 | 36,200 | 36.2% |
| Ads (Google, Meta, TikTok) | −21,000 | 21% |
| Affiliate/marketplace commissions | −2,500 | 2.5% |
| CM3 | 12,700 | 12.7% |
Out of $100k in revenue, $12.7k is left for rent, salaries and profit. The levers are now obvious: cutting ad spend by 5% at the same sales does more than growing revenue by 5%.
Where each line comes from
| Line | Source |
|---|---|
| Revenue, discounts, statuses | Shopify / WooCommerce |
| COGS | inventory system or a cost sheet by SKU |
| Shipping, returns | carrier APIs, ShipStation-like tools or the backend |
| Payment fees | Stripe balance transactions, PayPal reports |
| Ads | Google Ads, Meta, TikTok APIs |
| Marketplaces | Amazon/marketplace settlement reports |
The usual weak spot is COGS. It lives in a spreadsheet that gets updated whenever someone remembers. Make it part of the pipeline, with a check that every SKU sold has a cost (pipelines).
Margin by product and channel
The most valuable step is calculating CM2 and CM3 by product, category and channel:
- a high-revenue product can have a weak CM2 because it's bulky to ship;
- a category with high returns quietly eats margin;
- a channel with good ROAS can produce negative CM3 on low-margin products (ROAS vs POAS).
SELECT p.category,
       SUM(oi.revenue_net) AS revenue,
       SUM(oi.revenue_net - oi.cogs) AS cm1,
       SUM(oi.revenue_net - oi.cogs - oi.shipping_alloc - oi.fees_alloc - oi.returns_alloc) AS cm2,
       SAFE_DIVIDE(SUM(oi.revenue_net - oi.cogs - oi.shipping_alloc - oi.fees_alloc - oi.returns_alloc), SUM(oi.revenue_net)) AS cm2_pct
FROM order_items oi
JOIN products p USING (sku)
WHERE oi.order_month = '2026-09-01'
GROUP BY 1
ORDER BY cm2_pct;
Allocate order-level costs (shipping, fees) to line items in proportion to revenue or weight. Pick one rule and document it.
Showing it on the dashboard
- a waterfall from net revenue to CM3, the clearest chart you can show a founder;
- CM2% and CM3% by week, with the trend;
- a category table with CM1/CM2%, worst first;
- CM3 by acquisition channel;
- a flag for the share of SKUs with no COGS (data quality).
More on customer economics in the unit economics guide.
Common mistakes
- Calling revenue − COGS "margin" and stopping at CM1.
- Ignoring returns and return shipping.
- Taking fees from the pricing page instead of actual payouts.
- Forgetting discounts and store credit.
- Mixing tax-inclusive revenue with tax-exclusive costs.
Checklist
- Net revenue is defined the same way everywhere
- Every SKU sold has a COGS value
- Shipping, returns and packaging are tracked per order
- Payment fees come from actual payout data
- There's a documented rule for allocating order-level costs
- The CM1→CM3 waterfall is on the finance screen
- Results are split by category and channel
Step by step: from the P&L to contribution margin
Most businesses already have the inputs in their accounting, just grouped differently. To build a contribution margin view:
- List every cost line from the last 3 months of the P&L.
- Mark each line as variable (scales with orders or revenue) or fixed (stays the same if orders double).
- For variable lines, find the driver: per order (packaging, pick-and-pack), per unit (COGS), % of revenue (payment fees, marketplace commission), per shipment (carrier).
- Allocate variable costs to orders using those drivers, so each order, product and channel gets its share.
- Reconcile: the sum of allocated variable costs should match the P&L lines within a small margin.
SQL: contribution margin by channel and month
SELECT
  DATE_TRUNC(o.order_date, MONTH)                       AS month,
  o.channel,
  SUM(o.revenue_net)                                    AS revenue,
  SUM(o.cogs)                                           AS cogs,
  SUM(o.shipping_cost + o.packaging_cost)               AS fulfilment,
  SUM(o.payment_fee + o.marketplace_fee)                AS fees,
  SUM(o.return_cost)                                    AS returns,
  SUM(o.revenue_net - o.cogs) AS cm1,                   -- gross margin
  SUM(o.revenue_net - o.cogs - o.shipping_cost - o.packaging_cost
      - o.payment_fee - o.marketplace_fee - o.return_cost) AS cm2,
  ANY_VALUE(a.spend)                                    AS ad_spend,
  SUM(o.revenue_net - o.cogs - o.shipping_cost - o.packaging_cost
      - o.payment_fee - o.marketplace_fee - o.return_cost) - ANY_VALUE(a.spend) AS cm3
FROM clean.orders o
LEFT JOIN (
  SELECT DATE_TRUNC(day, MONTH) AS month, channel, SUM(spend) AS spend
  FROM clean.ad_spend GROUP BY 1, 2
) a ON a.month = DATE_TRUNC(o.order_date, MONTH) AND a.channel = o.channel
WHERE o.status = 'paid'
GROUP BY 1, 2
ORDER BY 1 DESC, cm3;
Channels with spend but no orders vanish from this join. In production, build the month × channel grid first, as described in the dashboard guide.
Worked example: a product that looks great until CM2
Illustrative monthly numbers for two products:
| Product X (bulky) | Product Y (compact) | |
|---|---|---|
| Revenue | 300,000 | 300,000 |
| COGS | 150,000 | 180,000 |
| CM1 (gross margin) | 150,000 (50%) | 120,000 (40%) |
| Orders | 400 | 400 |
| Shipping + packaging per order | 220 | 60 |
| Fulfilment | 88,000 | 24,000 |
| Fees (2.5%) | 7,500 | 7,500 |
| Returns (cost) | 18,000 | 6,000 |
| CM2 | 36,500 (12%) | 82,500 (28%) |
By gross margin, X is the better product. After fulfilment and returns, Y earns more than twice as much. Decisions that follow: price X to include shipping, set a minimum order for it, or stop advertising it as a hero product. These are the conversations a gross-margin-only report never starts.
Contribution margin targets
There's no universal "good" CM%. It depends on your fixed costs. The useful target is derived from your own P&L:
Required CM3 per month = fixed costs + target operating profit
If fixed costs are 400,000 a month and you want 100,000 operating profit, you need 500,000 of CM3. At a 20% CM3 rate, that's 2.5 million in revenue. If the rate drops to 16%, the same goal needs 3.1 million. That's why tracking the CM3 rate weekly matters as much as revenue.
What to do when margin falls
When the CM3 rate drops, walk the levels in order: CM1 (prices, discounts, COGS, product mix), then CM2 (shipping, returns, fees), then CM3 (ads). The cause almost always sits on one level, and that's where the fix is: the discount policy, the carrier rates or the budget of the channel with the worst POAS.
A few patterns I see often:
- CM1 falls, revenue grows. A promotion or a shift toward cheaper, lower-margin products. Check the share of discounted sales and the product mix before celebrating the revenue.
- CM2 falls with stable CM1. Carrier price changes, a rise in returns, or more orders just above the free-shipping threshold. Returns often lag by a few weeks, so watch the trend, not just the current month.
- CM3 falls with stable CM2. Ad costs went up faster than the orders they bring, often after scaling a campaign beyond its efficient audience.
Write down the cause and the action in the weekly review. After a few months, that log becomes the most useful document the business has about its own economics.
FAQ
How is contribution margin different from gross margin?
Gross margin is usually revenue minus COGS (CM1). Contribution margin takes out every variable cost of an order, including shipping, fees and ads.
Which costs count as variable?
Those that grow with each order: product, shipping, packaging, fees and acquisition ads. Rent, office salaries and software subscriptions are fixed and sit below CM3.
How often should I calculate it?
Weekly for operating decisions and monthly for the finance report. Daily, only CM3 after ads, as an operational check.
Can I do this without complex accounting?
Yes. A COGS sheet by SKU, an order export and ad spend are enough to start. Accuracy improves as you add actual fees and shipping costs.

DATUMPANEL — Business data analytics
DATUMPANEL is an independent data analyst based in Ukraine. I build dashboards for business owners, set up GA4 and the BigQuery export, and run data pipelines and Telegram auto-reports for e-commerce, service businesses, SaaS and agencies, from data audit to decisions.