Ecommerce KPIs: 15 metrics with formulas and where to get them
The key ecommerce KPIs with formulas (net revenue, conversion rate, AOV, margin, CAC, ROAS, MER, repeat rate, returns, stock-outs), plus which ones to check daily and which monthly.
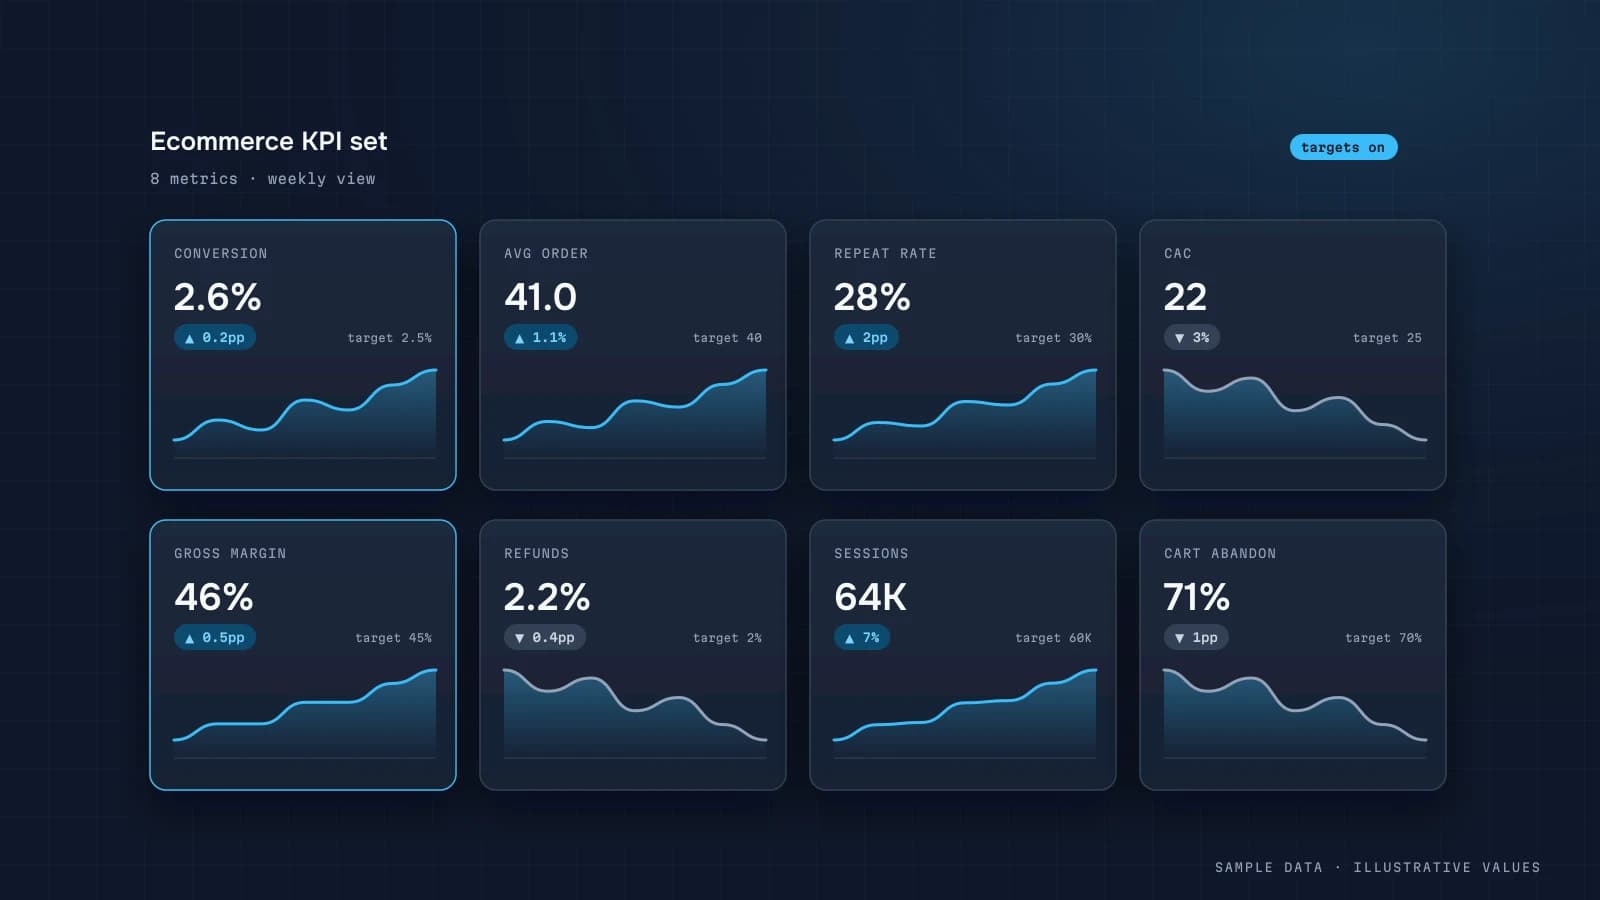
You could invent a hundred metrics for a store. About fifteen are actually useful, and only 5–6 of those deserve a daily look. Below is a reference with formulas, sources and cadence. I use it as the starting metric dictionary on projects.
Sales
| KPI | Formula | Source | Cadence |
|---|---|---|---|
| Net revenue | paid orders − refunds | store backend | daily |
| Orders | paid orders | backend | daily |
| AOV | revenue / orders | backend | daily |
| Units per order | units / orders | backend | weekly |
Decide which date counts: order creation or payment. With delayed payment methods (invoice, buy-now-pay-later) the gap can be days.
Site and conversion
| KPI | Formula | Source | Cadence |
|---|---|---|---|
| Sessions | — | GA4 | daily |
| Conversion rate | orders / sessions | backend + GA4 | daily |
| Add-to-cart rate | sessions with add_to_cart / sessions | GA4 | weekly |
| Checkout completion | purchase / begin_checkout | GA4 | weekly |
Split conversion by device. A drop in overall CR is often a mobile-checkout-only problem. Event setup is covered in GA4 ecommerce tracking.
Marketing
| KPI | Formula | Source | Cadence |
|---|---|---|---|
| Ad spend | sum across channels | ad APIs | daily |
| ROAS | channel revenue / channel spend | backend + ads | weekly |
| MER | total revenue / total spend | backend + ads | daily |
| CAC | spend / new customers | backend + ads | monthly |
Formulas and traps: ROAS vs POAS and LTV to CAC.
Profitability
| KPI | Formula | Source | Cadence |
|---|---|---|---|
| Gross margin % | (revenue − COGS) / revenue | backend + inventory | weekly |
| Contribution margin | revenue − COGS − shipping − fees − ad spend | all | weekly |
| Margin by product/category | the same at SKU level | backend + inventory | monthly |
This is the most important metric and the one stores calculate least often. See contribution margin.
Customers
| KPI | Formula | Source | Cadence |
|---|---|---|---|
| Repeat customer rate | customers with 2+ orders / all | backend | monthly |
| Revenue from returning customers | returning revenue / total | backend | monthly |
| LTV₁₂ | cohort 12-month cumulative margin / customers | backend | monthly |
| M1/M3 retention | cohorts | backend | monthly |
Cohort analysis is essential here.
Operations
| KPI | Formula | Source | Cadence |
|---|---|---|---|
| Return rate | returned orders / delivered orders | backend | weekly |
| Shipping cost per order | shipping cost / orders | carrier or backend | weekly |
| Best-seller stock-outs | best-sellers at zero stock | inventory | daily |
For apparel especially, returns quietly eat margin. Shipping goes both ways, and the item may not be resellable.
What goes on the first screen
For most stores:
- Net revenue
- Orders
- AOV
- Conversion rate by device
- MER
- Contribution after ad spend
Everything else goes on Marketing, Products and Customers tabs (store dashboard structure).
Keeping KPIs from turning into noise
- Every metric has an owner and a defined action when it goes off track.
- Compare with the same weekday or a 4-week average.
- On small volumes, read weekly values, not daily ones.
- Label where each metric comes from and how it's calculated. That ends most "my number is different" arguments.
How the KPIs connect: a driver tree
KPIs are most useful as a tree, where each level explains the one above it:
Contribution margin
├── Revenue = Sessions × Conversion rate × AOV
│   ├── Sessions: by channel (paid, organic, email, direct)
│   ├── Conversion rate: by device, landing page, new vs returning
│   └── AOV: items per order × price per item − discounts
└── Variable costs
    ├── COGS (% of revenue)
    ├── Fulfilment per order
    ├── Payment fees
    └── Ad spend → CAC for new customers
When a top number moves, walk down the tree. You'll usually find the cause two levels below.
Worked example: formulas with sample numbers
All figures are illustrative, for one month:
| KPI | Formula | Example |
|---|---|---|
| Conversion rate | orders / sessions | 1,200 / 80,000 = 1.5% |
| AOV | revenue / orders | 1,320,000 / 1,200 = 1,100 |
| Items per order | units / orders | 2,160 / 1,200 = 1.8 |
| New customer share | first orders / orders | 780 / 1,200 = 65% |
| CAC | ad spend / new customers | 234,000 / 780 = 300 |
| Repeat rate (90 d) | customers with 2+ orders in 90 days / customers | 18% |
| Refund rate | refunded revenue / revenue | 39,600 / 1,320,000 = 3% |
| Contribution margin % | (revenue − variable costs − ads) / revenue | 22% |
Two practical notes. First, compute conversion rate from the same source as sessions (GA4) but count orders from the backend if GA4 misses some. Then label it clearly, because it'll differ from GA4's own number. Second, CAC uses only new customers. Dividing spend by all orders makes acquisition look cheaper than it is.
SQL: one weekly KPI table
WITH o AS (
  SELECT DATE_TRUNC(order_date, WEEK(MONDAY)) AS week,
         COUNT(*) AS orders,
         SUM(revenue_net) AS revenue,
         COUNTIF(is_first_order) AS new_customers,
         SUM(units) AS units,
         SUM(refund_amount) AS refunds
  FROM clean.orders WHERE status = 'paid' GROUP BY 1
),
s AS (SELECT DATE_TRUNC(day, WEEK(MONDAY)) AS week, SUM(sessions) AS sessions FROM mart.daily_sessions GROUP BY 1),
a AS (SELECT DATE_TRUNC(day, WEEK(MONDAY)) AS week, SUM(spend) AS spend FROM clean.ad_spend GROUP BY 1)
SELECT o.week, s.sessions, o.orders,
       SAFE_DIVIDE(o.orders, s.sessions)        AS conversion_rate,
       SAFE_DIVIDE(o.revenue, o.orders)         AS aov,
       SAFE_DIVIDE(o.units, o.orders)           AS items_per_order,
       SAFE_DIVIDE(a.spend, o.new_customers)    AS cac,
       SAFE_DIVIDE(o.refunds, o.revenue)        AS refund_rate
FROM o LEFT JOIN s USING (week) LEFT JOIN a USING (week)
ORDER BY week DESC;
Weekly granularity smooths out weekday noise and is the right level for most decisions. Keep daily only for monitoring.
Benchmarks: compare with yourself first
Industry averages for conversion rate or AOV vary hugely by category, price point, traffic mix and country, and most published "benchmarks" don't say how they were measured. Your most reliable benchmark is your own history:
- the same week last year (seasonality)
- the trailing 4-week average (trend)
- the plan, if you have one
If you do use an external benchmark, write down its source and method next to the number, and treat it as context, not a target.
Alert thresholds that don't cry wolf
| KPI | Alert when | Why this rule |
|---|---|---|
| Orders (daily) | below 60% of the same-weekday 4-week average | catches checkout or tracking breaks without firing on normal dips |
| Conversion rate (daily, by device) | drops more than 30% vs 4-week average with 500+ sessions | small samples are noise |
| Refund rate (weekly) | above 1.5× the 8-week average | early sign of a product or delivery issue |
| CAC (weekly, by channel) | above max CAC from unit economics | money is being lost on new customers |
Tune the thresholds after a month. If an alert fires weekly and nobody acts on it, the threshold is wrong.
Common mistakes with ecommerce KPIs
| Mistake | What goes wrong | Fix |
|---|---|---|
| Averaging percentages | the average of daily conversion rates ≠ the period's conversion rate | always recompute from totals: Σ orders / Σ sessions |
| Revenue with VAT and shipping in some reports, without in others | numbers never match between screens | one definition in the glossary, applied everywhere |
| Counting cancelled orders | inflated revenue, then a "drop" when they cancel | count paid orders; show cancellations separately |
| Comparing to yesterday | weekday effects look like trends | compare with the same weekday last week |
| Tracking 40 KPIs | nobody knows which matter | 5–7 on the first screen, the rest one click away |
| AOV without items per order | can't tell price effects from basket effects | show both side by side |
Give every KPI an owner and a lever
A KPI nobody owns is just a number. For each KPI on the first screen, write down who's responsible and what they can change:
| KPI | Owner | Levers |
|---|---|---|
| Conversion rate | e-commerce manager | checkout UX, page speed, payment methods, product pages |
| AOV | merchandising | bundles, thresholds, cross-sell, pricing |
| CAC | marketing | channel mix, targeting, creatives, bids |
| Repeat rate | CRM/retention | post-purchase emails, loyalty, assortment |
| Refund rate | operations | product descriptions, sizing info, packaging, carrier choice |
In the weekly meeting, each owner explains their number's movement in one sentence. That routine turns a dashboard into a management tool.
Reviewing the KPI set itself
Once a quarter, look at the KPI list rather than the values. Remove KPIs nobody has acted on in three months, add ones that came up repeatedly as questions, and check that each still has an owner. A KPI set that never changes usually means nobody is really using it.
FAQ
What's a normal ecommerce conversion rate?
It depends on category, price point, traffic mix and device. The best benchmark is your own trend by device and channel, not an average you found online.
Should revenue include tax?
For management reporting, exclude sales tax/VAT so margin and ROAS reflect money you actually keep. Whatever you pick, be consistent across reports.
How do refunds affect AOV?
The simplest definition is net revenue / paid, non-cancelled orders. Put the definition in the metric's tooltip.
How many KPIs should a dashboard have?
Up to 6 on the first screen. The workspace as a whole can hold 30, grouped into sections.

DATUMPANEL — Business data analytics
DATUMPANEL is an independent data analyst based in Ukraine. I build dashboards for business owners, set up GA4 and the BigQuery export, and run data pipelines and Telegram auto-reports for e-commerce, service businesses, SaaS and agencies, from data audit to decisions.