Unit economics: formulas, a worked example and a dashboard
How to calculate unit economics for an online store, a service business or SaaS (CAC, contribution per order, LTV, payback) from real CRM and ad data, and how to turn it into a dashboard you check every week.
Revenue is growing, ad spend is growing, the team is busy, and there's no more cash in the bank than before. That's the textbook symptom of a business that doesn't track unit economics. Unit economics answers one question: do we make money on each customer (order, subscription) after every variable cost, acquisition included?
Pick your unit
The unit is the thing the business earns on:
| Model | Unit |
|---|---|
| Online store | order or customer |
| Service business | visit/booking or client |
| SaaS | paying account |
| Agency | client contract |
Use the customer as the unit if people buy again, and the order if the business is mostly one-off.
Core formulas
| Metric | Formula |
|---|---|
| AOV | revenue / orders |
| Contribution per order | AOV − COGS − shipping − payment fees − packaging |
| CAC | acquisition spend / new customers |
| Purchase frequency | orders / customers in period |
| LTV (gross profit) | contribution per order × expected orders per customer |
| LTV:CAC | LTV / CAC |
| CAC payback (months) | CAC / monthly contribution per customer |
One point that matters: calculate LTV in gross profit, not revenue. Revenue LTV looks great and misleads. More on this in LTV to CAC ratio.
A worked example for an online store
Illustrative monthly numbers.
| Line | Value |
|---|---|
| Revenue | $60,000 |
| Orders | 1,500 |
| AOV | $40 |
| COGS (50%) | $20 |
| Shipping you pay | $3 |
| Payment fees (Stripe-like, ~3%) | $1.20 |
| Packaging | $0.50 |
| Contribution per order | $15.30 |
| Ad spend | $12,000 |
| New customers | 600 |
| CAC | $20 |
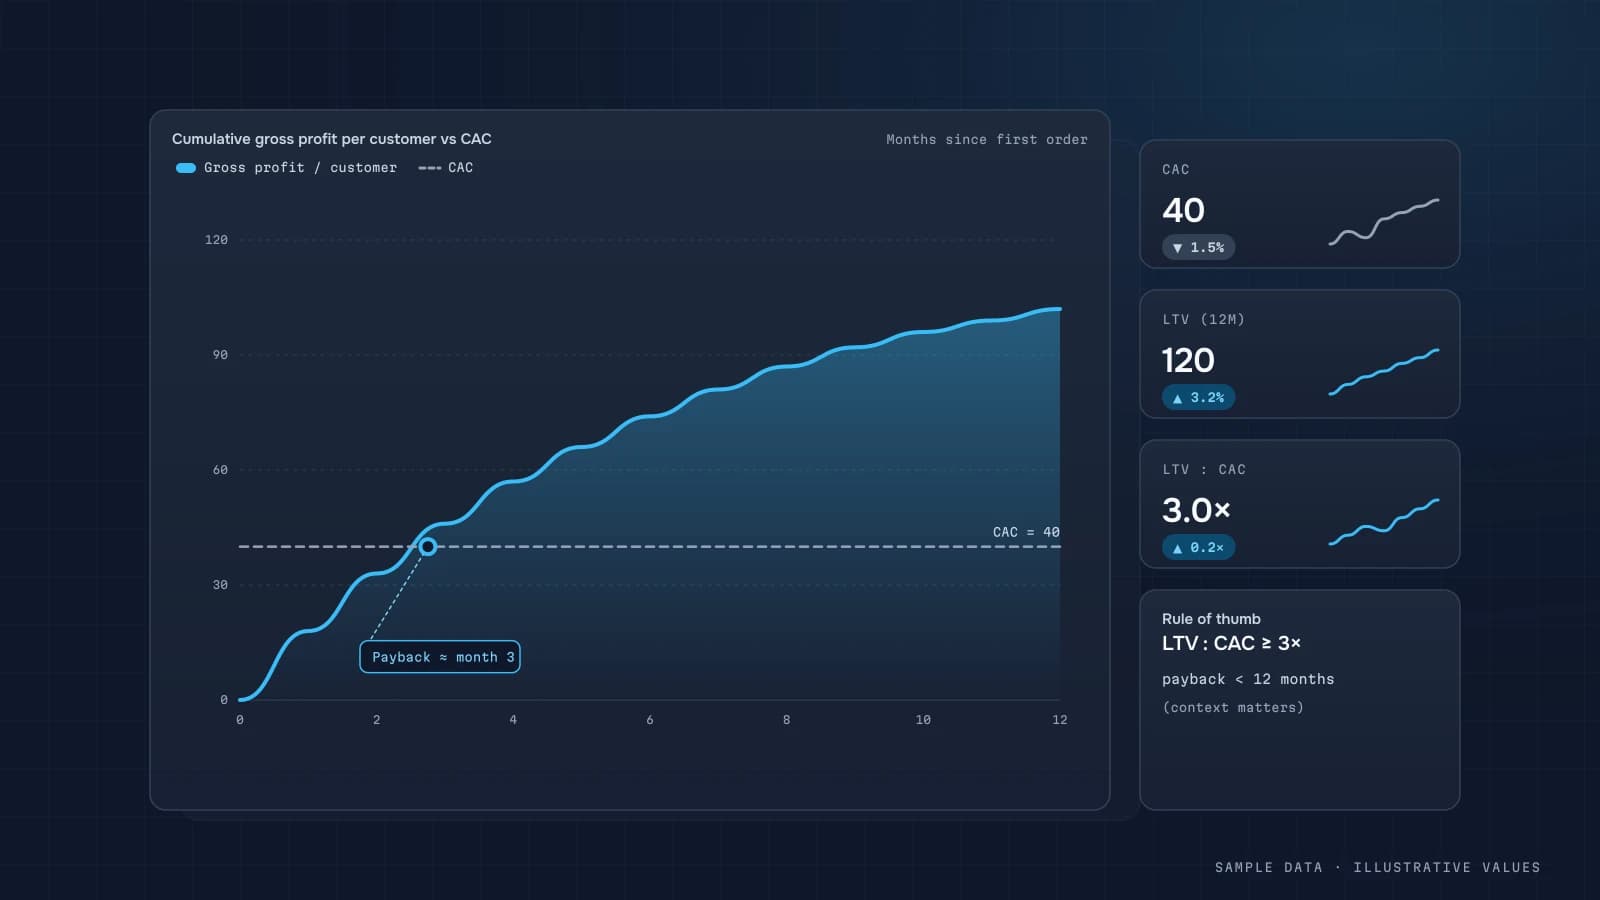
A new customer's first order brings in $15.30 of contribution against a $20 CAC, so you're −$4.70 on the first purchase. Is that bad? It depends on repeat buying. If the average customer orders 2.2 times a year, LTV ≈ $15.30 × 2.2 = $33.70 and LTV:CAC ≈ 1.7. The business works, but the margin for error is thin, so work on CAC and on retention.
Payment fees depend on your contract and card mix. Use the actual fees from your payout reports, not the pricing page.
Where the data comes from
| Metric | Source |
|---|---|
| Orders, amounts, status, customer | Shopify / WooCommerce or your CRM |
| COGS | inventory or accounting system |
| Shipping | store backend or carrier API |
| Payment fees | Stripe / PayPal balance transactions |
| Ad spend | Google Ads, Meta, TikTok |
| Customer's first source | UTMs on the order, GA4 via BigQuery |
The formulas are the easy part. The hard part is joining everything at the customer and order level, which is what a pipeline is for (data pipelines).
Unit economics by channel
A blended average hides channels that lose money. Calculate CAC and LTV separately by each customer's first channel:
| Channel | CAC | 12-mo LTV | LTV:CAC |
|---|---|---|---|
| Google Search | $16 | $38 | 2.4 |
| Meta | $22 | $31 | 1.4 |
| TikTok | $19 | $21 | 1.1 |
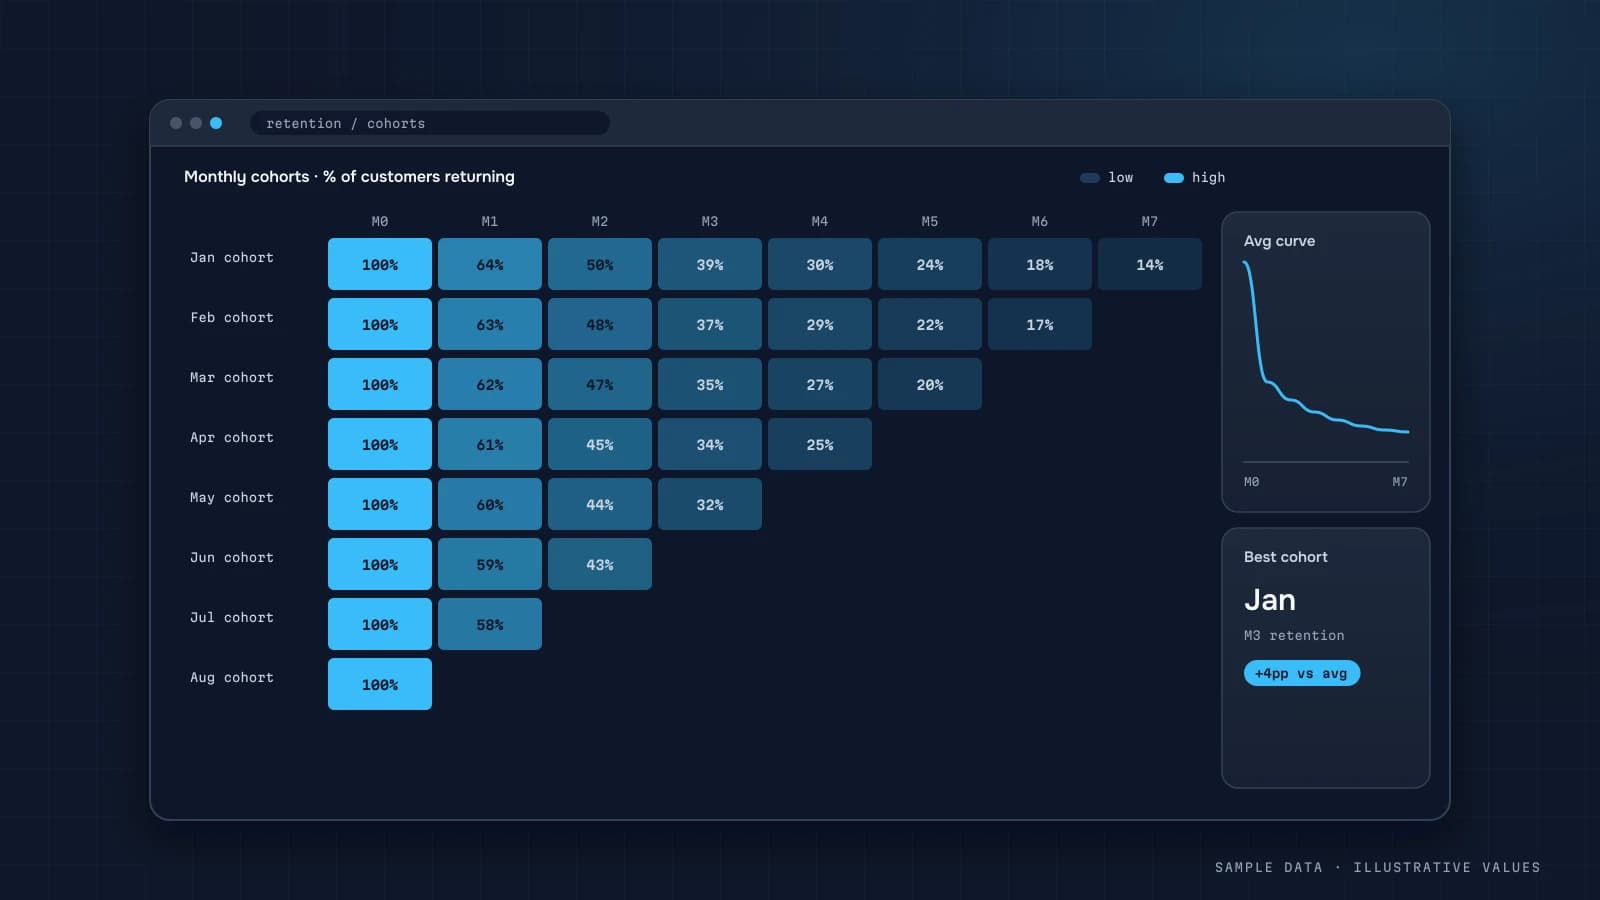
Illustrative. Channel-level LTV needs cohort analysis, because customers from different channels retain differently.
SaaS and service businesses
SaaS: the unit is the paying account. ARPA × gross margin / monthly churn = LTV. CAC payback in months is the key health metric. See SaaS metrics dashboard.
Service businesses: the unit is the client. What matters is visit value, visit frequency, no-shows and staff utilisation. Acquisition cost often hides in booking-platform commissions. See service business analytics.
What the dashboard looks like
First screen:
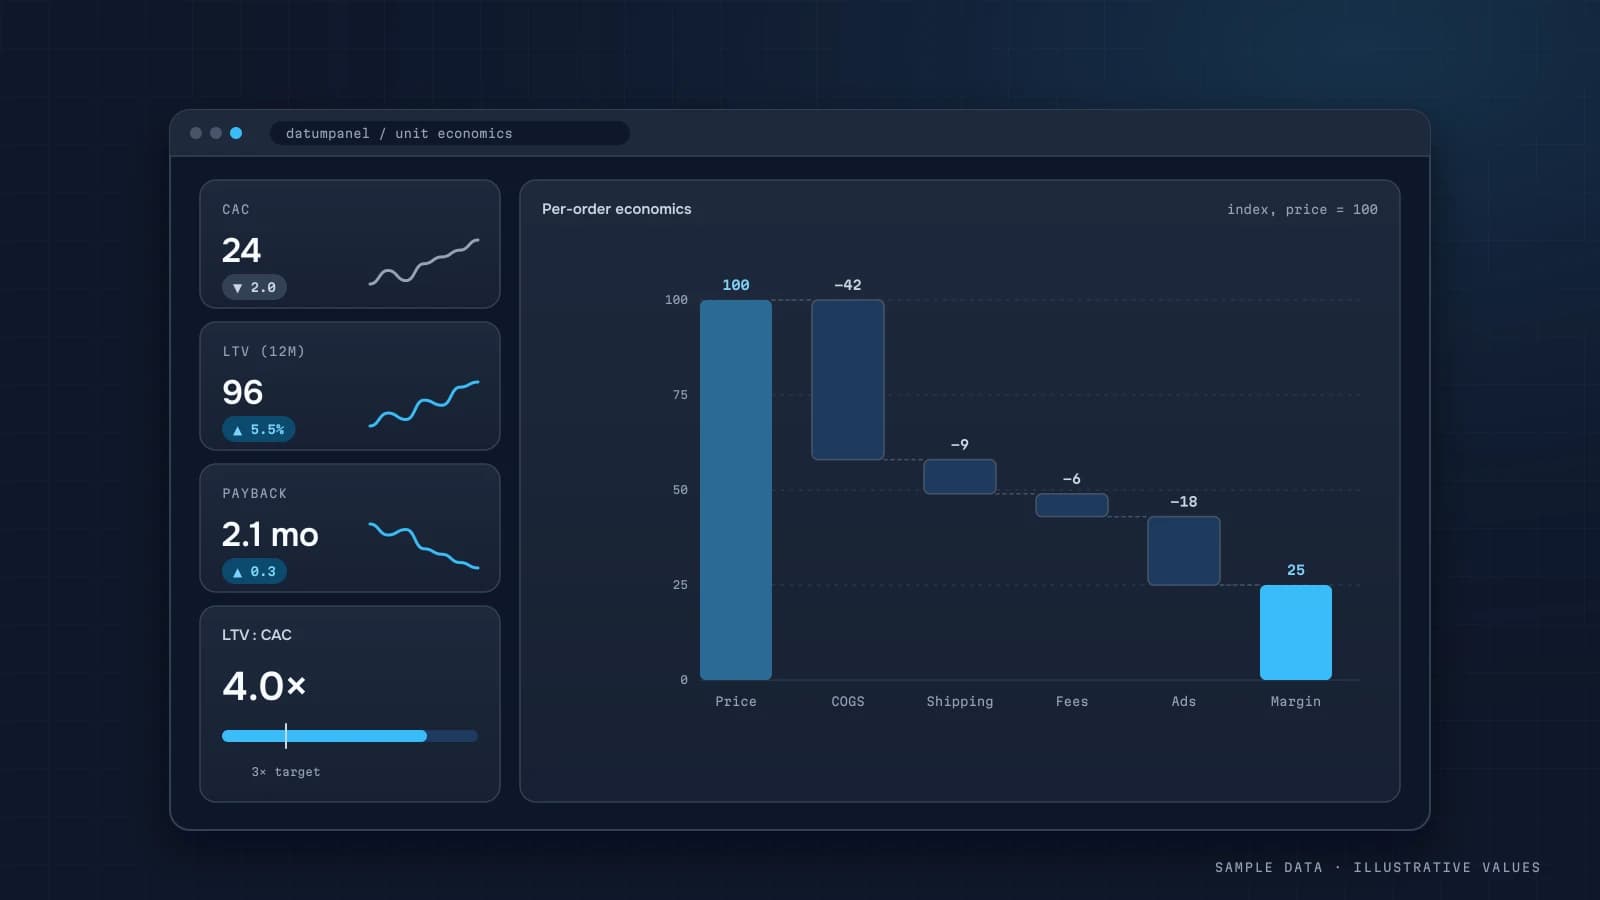
- contribution per order, with a waterfall from AOV down to contribution;
- CAC, blended and by channel;
- 6- and 12-month LTV by cohort;
- LTV:CAC and CAC payback;
- repeat purchase share.
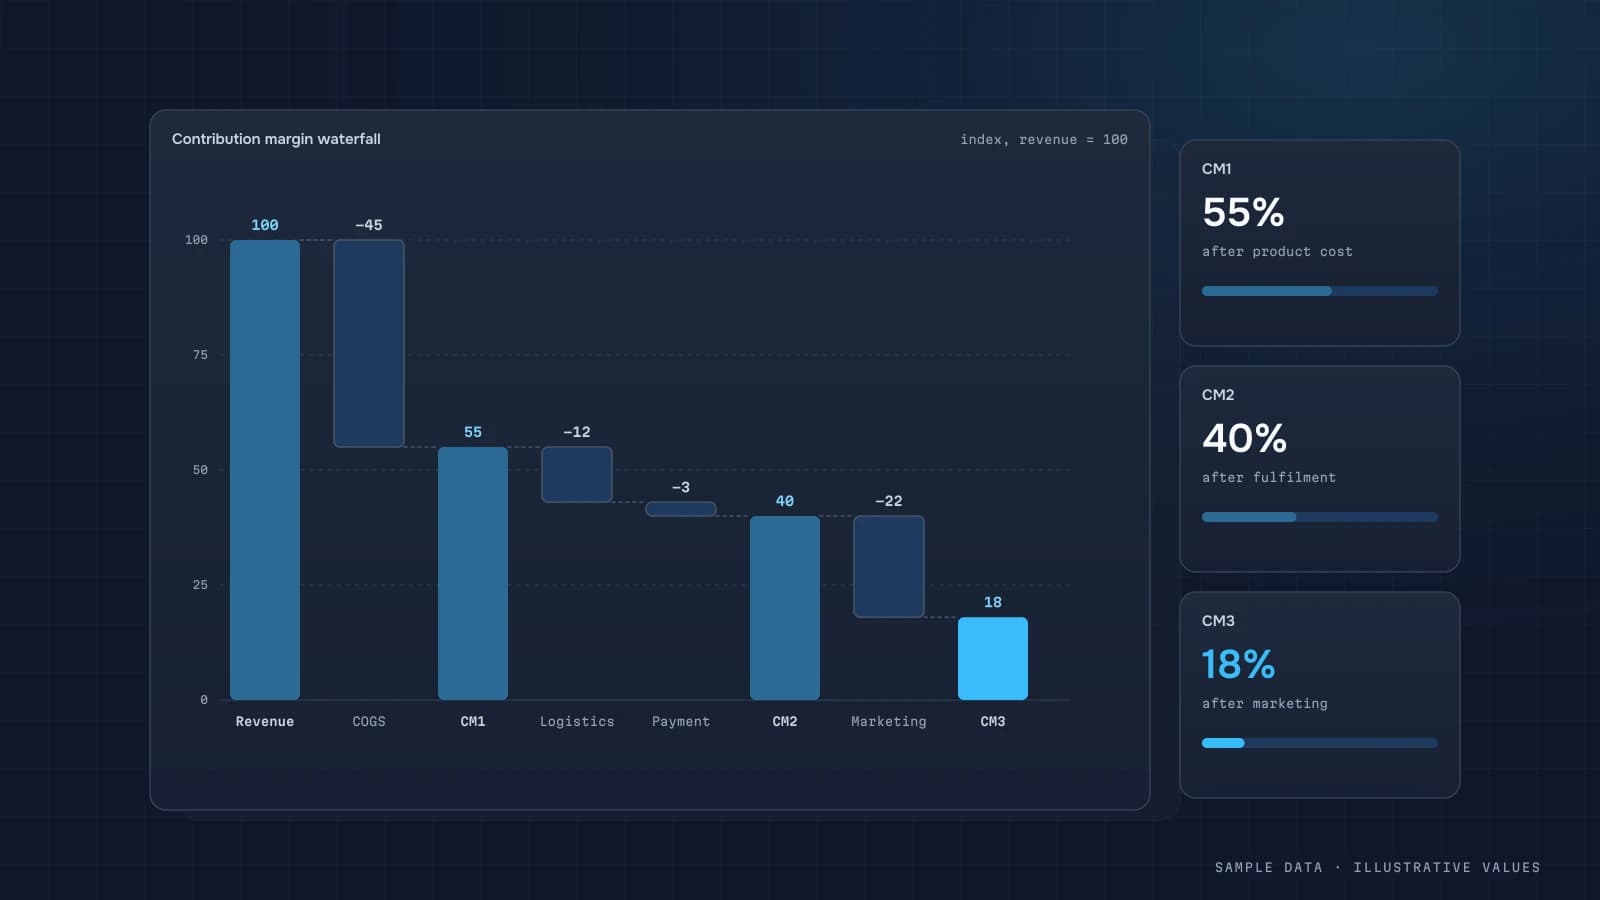
Below that sit a channel table and monthly cohorts. For showing an owner where the money goes, nothing beats a revenue-to-contribution waterfall (see contribution margin).
Common mistakes
- LTV in revenue instead of margin.
- CAC that leaves out part of acquisition cost (agency fees, creative, first-order discounts).
- Mixing new and returning customers in CAC.
- Blended averages with no channel or cohort split.
- Ignoring refunds.
Checklist
- The unit is defined (customer or order)
- COGS and logistics are allocated per order
- Payment fees come from payout data
- CAC is counted on new customers only
- LTV is in gross profit and split by cohort
- Results are split by first-touch channel
- It refreshes at least weekly
Step by step: building unit economics from your own data
The formulas are simple. Getting trustworthy inputs is the real work. This is the order I go in:
- Pick the money source. Paid orders from the payment provider or CRM, net of refunds and VAT. Not GA4 revenue.
- Attach product cost to each order line. If cost lives in a spreadsheet, load it as a table with a
valid_fromdate so price changes don't rewrite history. - Attach variable costs per order. Shipping (actual, from the carrier invoice if possible), packaging, payment fees, marketplace commissions.
- Attach acquisition cost per customer. Ad spend by channel and day, divided by new customers from that channel. See CAC and LTV.
- Aggregate by the unit you chose (order, customer, subscription) and by month.
- Reconcile the monthly totals against the accounting or management P&L. A gap of more than a few percent means a missing cost line.
SQL: margin per order
SELECT
  o.order_id,
  o.order_date,
  o.channel,
  o.revenue_net,
  SUM(li.qty * c.unit_cost)                      AS cogs,
  o.shipping_cost + o.packaging_cost            AS fulfilment,
  o.revenue_net * f.payment_fee_rate            AS payment_fee,
  o.revenue_net
    - SUM(li.qty * c.unit_cost)
    - (o.shipping_cost + o.packaging_cost)
    - o.revenue_net * f.payment_fee_rate        AS margin_before_ads
FROM orders o
JOIN order_lines li ON li.order_id = o.order_id
JOIN product_costs c
  ON c.sku = li.sku
 AND o.order_date >= c.valid_from
 AND (c.valid_to IS NULL OR o.order_date < c.valid_to)
JOIN fee_rates f ON f.payment_method = o.payment_method
WHERE o.status = 'paid'
GROUP BY o.order_id, o.order_date, o.channel, o.revenue_net,
         o.shipping_cost, o.packaging_cost, f.payment_fee_rate;
From here, average margin_before_ads per order, subtract CAC per new customer (or ad cost per order for repeat-heavy businesses), and you have the unit result. The valid_from/valid_to join is what keeps last year's margins correct after a supplier raises prices.
Break-even acquisition cost
The most useful single number on a unit economics dashboard is the maximum you can pay for a customer:
Max CAC = margin before ads per order × expected orders per customer over your payback horizon
Illustrative example: margin before ads is 300 per order. Customers place on average 1.6 orders in their first 6 months. If you want acquisition to pay back within 6 months, max CAC = 300 × 1.6 = 480. If a channel's CAC is 350, it pays back. If it's 600, every new customer from it loses money over that horizon, however good its ROAS looks.
Use cohort data for the "orders per customer" input, not a guess. See cohort analysis.
Sensitivity: which lever matters most
Owners often ask "should we raise prices, cut shipping or lower CAC?" A sensitivity table answers that with your own numbers. Illustrative base: AOV 1,000, COGS 52%, fulfilment 90, payment fees 2%, CAC 250, one order per new customer in the period.
| Change (alone) | Unit margin after CAC | Change vs base |
|---|---|---|
| Base | 1,000 − 520 − 90 − 20 − 250 = 120 | — |
| Price +5% (AOV 1,050, same COGS in money) | 1,050 − 520 − 90 − 21 − 250 = 169 | +41% |
| Fulfilment −20 | 140 | +17% |
| CAC −10% (225) | 145 | +21% |
| COGS −2 pp (50%) | 140 | +17% |
In this example a 5% price increase does more than any cost cut, provided conversion holds. That's a testable hypothesis, not a conclusion. Building the table for your real numbers takes an hour and usually changes the conversation.
Monthly review routine
- Unit margin after CAC by channel, this month vs the last 3
- Max CAC vs actual CAC per channel
- Top 10 SKUs by margin contribution, and bottom 10 (often surprising)
- Share of orders with negative margin (free-shipping thresholds and discounts are common culprits)
- Any cost input that changed (supplier price, carrier rates, fee rates) and its effect
Worked example: the free-shipping threshold trap
Free shipping above a threshold is one of the most common sources of hidden negative-margin orders. Illustrative numbers: free shipping from 800, actual shipping cost 110, product margin (after COGS) 45%, payment fees 2%.
| Order value | Product margin | Shipping paid by you | Fees | Margin before ads |
|---|---|---|---|---|
| 790 (customer pays shipping) | 356 | 0 | 16 | 340 |
| 810 (free shipping) | 365 | 110 | 16 | 239 |
| 1,200 (free shipping) | 540 | 110 | 24 | 406 |
An order just above the threshold earns about 30% less than one just below it. That's fine if the threshold lifts average order value overall, and costly if most orders simply land at 800–900. The check takes one query: the distribution of order values in 50-unit buckets around the threshold, with margin per bucket. If there's a spike just above the line and margin dips there, test a higher threshold or a minimum-basket rule.
Allocation traps
Unit economics breaks when costs are put in the wrong bucket. The usual suspects:
| Cost | Common mistake | Better treatment |
|---|---|---|
| Returns | ignored, or only the refund counted | refund + return shipping + write-offs, allocated to the original order's month and channel |
| Discounts and promo codes | revenue shown before discount | always use the net paid amount |
| Marketplace commissions | lumped into "marketing" | variable cost per order on that marketplace |
| Warehouse staff | treated as variable per order | fixed cost; keep it out of contribution margin and show it in the P&L layer |
| Influencer barter (free product) | not counted at all | product cost as acquisition cost for that channel |
The rule of thumb: if a cost scales with orders, it goes into the unit. If it stays when orders double, it's fixed and belongs below contribution margin.
Presenting it to an owner who isn't a finance person
Unit economics dashboards fail when they look like an accounting report. What works better:
- Start with one sentence. "On an average order we keep 120 after all variable costs and ads; last month it was 150." Then show the chart.
- Show the waterfall for one average order, from price down to unit margin. People grasp "where the money goes" far faster from a waterfall than from a table.
- Show channels as rows, not as separate charts: CAC, max CAC, unit margin after CAC, with a clear marker for channels that are underwater.
- Put assumptions in plain view: payback horizon, cost-table date, which costs count as variable. When someone disagrees with a number, the conversation moves to the assumption, which is where it should be.
Keep the detail one click away (per-SKU tables, per-order lists), not on the first screen.
FAQ
What's a good LTV:CAC ratio?
3:1 is the common rule of thumb, but it's a heuristic, not a law. What matters more is how many months CAC takes to pay back and whether you have the cash to survive until then.
Can I do this in a spreadsheet?
Yes, for a first estimate. It breaks down when you need weekly refreshes and channel and cohort splits. That's when automating data collection pays off.
How should discounts be treated?
If everyone gets the discount, treat it as reduced order revenue. If it's a first-order discount aimed at acquisition, count it as part of CAC.
Is a loss-making first order a problem?
Not necessarily. Many stores run that way on purpose, because repeat purchases pay back acquisition. Know how many months payback takes and keep an eye on it.

DATUMPANEL — Business data analytics
DATUMPANEL is an independent data analyst based in Ukraine. I build dashboards for business owners, set up GA4 and the BigQuery export, and run data pipelines and Telegram auto-reports for e-commerce, service businesses, SaaS and agencies, from data audit to decisions.