RFM segmentation: segments, SQL and what to do with each
How to run RFM segmentation on a store's or service business's customer base using recency, frequency and monetary value. Covers scoring rules, a SQL query, ready-made segments (champions, at risk, hibernating) and the campaign to run for each.
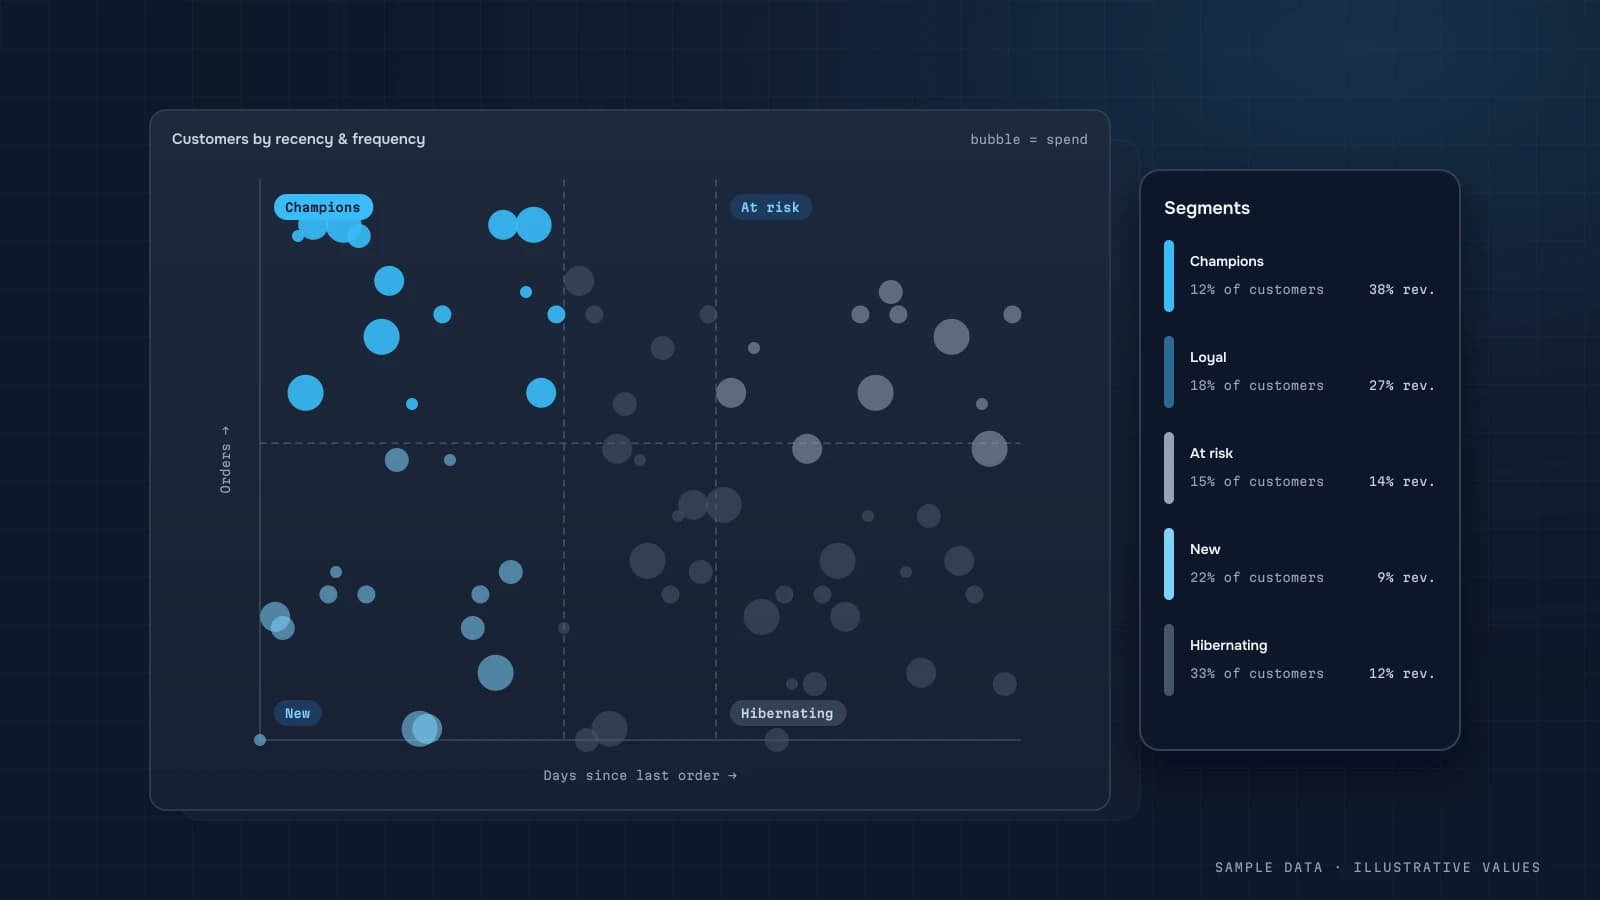
Your store has thousands of customers, and every one of them gets the same newsletter. RFM is the simplest way to split customers by behaviour and talk to each group differently. You don't need machine learning for it, just order history.
Three dimensions
| Letter | What it measures | How |
|---|---|---|
| R: Recency | how recently they bought | days since the last order |
| F: Frequency | how often | orders in a window (e.g. 12 months) |
| M: Monetary | how much | revenue or margin in the window |
Each dimension is scored, usually 1–5 by quintile, with 20% of customers per score. R 5 means bought recently, F 5 means buys most often, M 5 means spends most.
SQL (PostgreSQL)
WITH base AS (
  SELECT customer_id,
         CURRENT_DATE - MAX(order_date)::date AS recency_days,
         COUNT(*) AS frequency,
         SUM(revenue_net) AS monetary
  FROM orders
  WHERE status = 'paid' AND order_date >= CURRENT_DATE - INTERVAL '365 day'
  GROUP BY 1
)
SELECT customer_id, recency_days, frequency, monetary,
       6 - NTILE(5) OVER (ORDER BY recency_days) AS r,
       NTILE(5) OVER (ORDER BY frequency) AS f,
       NTILE(5) OVER (ORDER BY monetary) AS m
FROM base;
A catch with F: in many stores most customers have exactly one order, which breaks the quintiles. In that case set the thresholds by hand, for example 1, 2, 3–4, 5–7, 8+ orders.
Segments
Score combinations roll up into segments you can act on:
| Segment | Rule (R, F) | Meaning | Action |
|---|---|---|---|
| Champions | R 5, F 4–5 | buy often and recently | early access, loyalty perks, ask for reviews |
| Loyal | R 3–5, F 3–5 | regular buyers | cross-sell, bundles |
| Promising newcomers | R 4–5, F 1 | just made a first purchase | welcome flow, second purchase |
| Need attention | R 3, F 2–3 | buying less than before | personal picks |
| At risk | R 1–2, F 3–5 | used to be active, gone quiet | win-back offer, survey |
| Can't lose | R 1–2, F 5, M 5 | big customers who stopped | personal outreach |
| Hibernating | R 1–2, F 1–2 | long ago, rarely | cheap channels or pause |
M is usually used for priority: within each segment, start with the high-M customers.
Putting it to work
- Recompute RFM weekly in the pipeline (ETL).
- Write the segment to your CRM or email platform as a customer attribute.
- Automate flows. Moving from "Promising" to "At risk" triggers an email or message.
- Review monthly with a dashboard of segment sizes and the movements between them.
On the dashboard
- the size and revenue of each segment;
- an R × F matrix (a heatmap of customer counts);
- monthly segment transitions (how many Loyal customers became At risk);
- campaign results by segment: opens, repeat purchases, revenue.
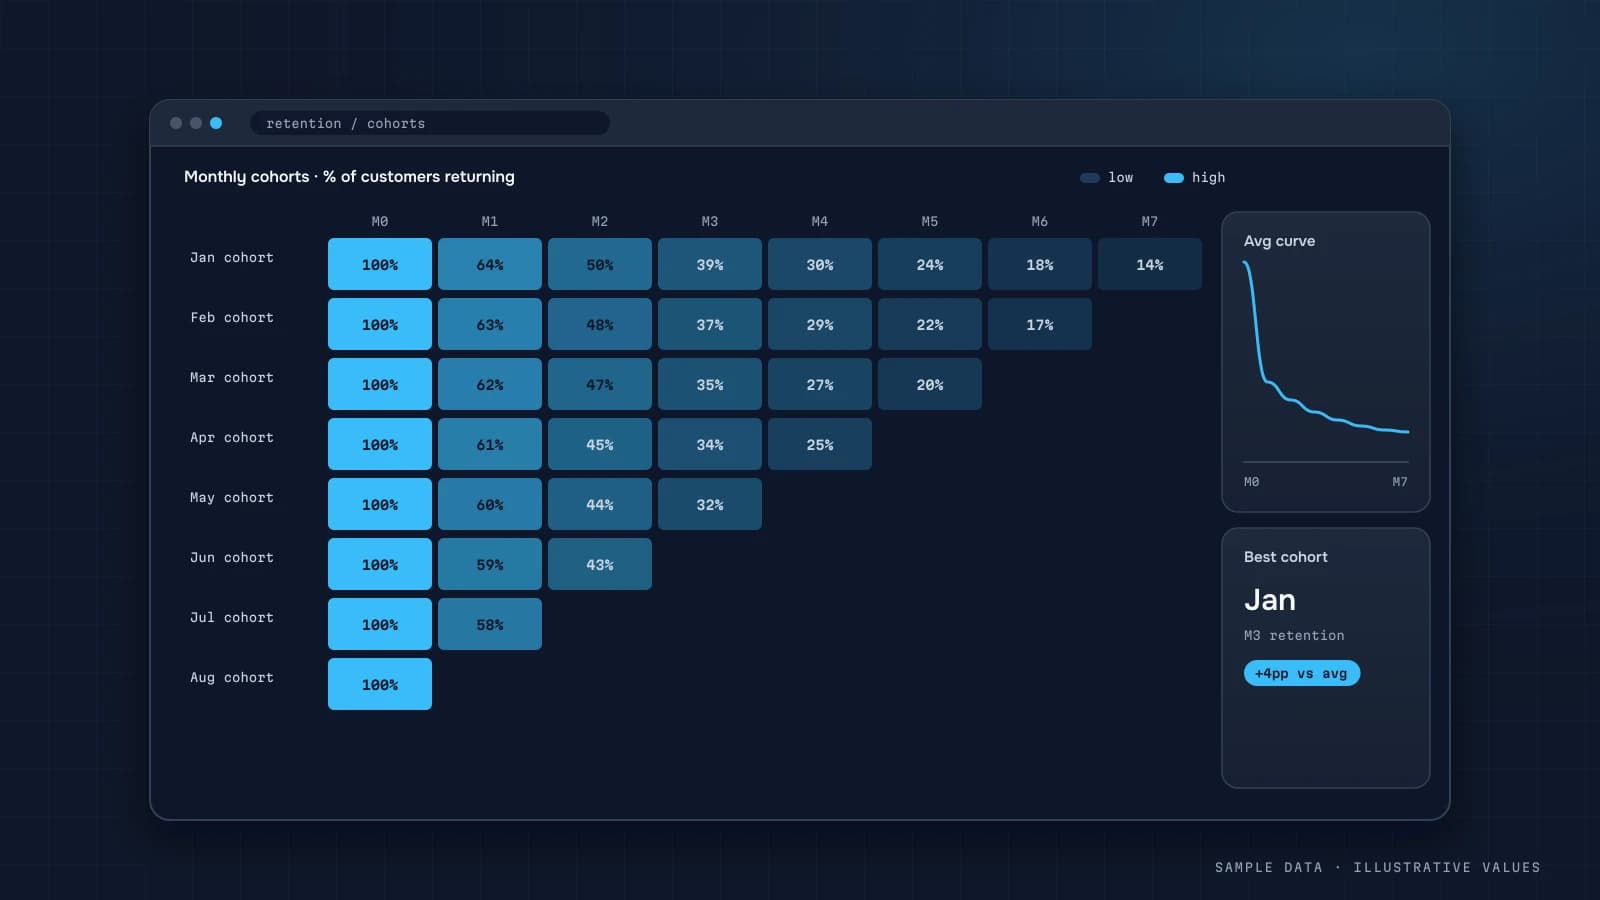
RFM pairs well with cohort analysis. Cohorts show how a generation of customers retains, and RFM tells you who to win back right now. Use LTV to put a value on each segment.
Adjustments by business type
- Service businesses: measure R against the normal visit interval. A client who books a haircut every five weeks is overdue by week eight.
- Long-cycle products (electronics, furniture): F is almost always 1, so use RM or category-based segments.
- B2B: M in margin, F as the number of deals or active months.
Common mistakes
- Calculating M on revenue with refunds left in.
- Using all-time data instead of a fixed window.
- Building segments and then never acting on them.
- Customer IDs that differ between systems (email vs account ID).
Checklist
- One customer identifier (normalised email or ID)
- A fixed analysis window (e.g. 12 months)
- F thresholds that reflect your customer base
- Named segments with defined actions
- Segment written to the CRM/email platform
- Weekly recompute
- Segment transition report
Worked example: scoring five customers
Illustrative store, analysis date 1 October, scores 1–5 by quintile across all customers:
| Customer | Last order | Orders (12 mo) | Revenue (12 mo) | R | F | M | Segment |
|---|---|---|---|---|---|---|---|
| A | 20 Sep | 9 | 14,200 | 5 | 5 | 5 | Champions |
| B | 2 Aug | 4 | 5,100 | 4 | 4 | 4 | Loyal |
| C | 12 Sep | 1 | 1,300 | 5 | 1 | 2 | New |
| D | 15 Mar | 6 | 8,900 | 2 | 5 | 5 | At risk (valuable, gone quiet) |
| E | 10 Nov last year | 1 | 600 | 1 | 1 | 1 | Lost |
D is the one worth acting on today: a high-value customer whose last order was over six months ago. A personal win-back offer to the "At risk" group usually pays for itself far more readily than a blanket discount to everyone. E isn't worth much effort. C needs a good second-purchase experience, which is where most of the future value of a store is decided.
Choosing the score boundaries
Quintiles (each score covers 20% of customers) are the default, but they break in two common cases:
- Most customers have one order. If 70% bought once, F quintiles can't split them. Use fixed boundaries instead: F = 1 for one order, 2 for two, 3 for 3–4, 4 for 5–7, 5 for 8+.
- Purchase cycles differ by category. "90 days since last order" is recent for furniture and very lapsed for coffee. Set R boundaries from your own repeat-purchase intervals: for example R = 5 if within the median interval, R = 1 if beyond 3× the median.
Document the boundaries you choose. When they change, segment sizes jump, and that shouldn't be confused with a change in customer behaviour.
Tracking segment movement
The most useful RFM report isn't the snapshot. It's the movement between snapshots. Monthly, show how many customers moved between key segments:
| From → To | Customers | What it signals |
|---|---|---|
| New → Loyal | 120 | second-purchase flows working |
| Loyal → At risk | 85 | something cooled; check product, delivery, competitors |
| At risk → Loyal | 30 | win-back campaign effect |
| At risk → Lost | 60 | missed opportunity |
SELECT prev.segment AS from_segment, cur.segment AS to_segment, COUNT(*) AS customers
FROM mart.rfm_snapshot cur
JOIN mart.rfm_snapshot prev
  ON prev.customer_id = cur.customer_id
 AND prev.snapshot_date = DATE_SUB(cur.snapshot_date, INTERVAL 1 MONTH)
WHERE cur.snapshot_date = @this_month
GROUP BY 1, 2
ORDER BY customers DESC;
Store a snapshot each month instead of recomputing history, so the movement report reflects what you knew at the time.
Privacy
RFM uses purchase history, which is personal data. Keep segment exports for campaigns to the fields the campaign needs, respect marketing consent flags when building audiences, and avoid uploading full purchase histories to ad platforms when a segment ID or a hashed contact list will do.
How often to recompute
For most stores, a monthly recompute is enough, with a weekly refresh of R (recency) only for triggered emails. A full daily recompute makes sense only when automated flows react to segments, for example a "we miss you" email on day 60 without an order.
Measuring whether segment campaigns work
Segment campaigns are easy to overrate, because the customers you target were often going to buy anyway. Hold out a random 10–20% of each targeted segment and send them nothing. After the campaign window, compare purchase rate and revenue per customer between the contacted group and the holdout:
| Group | Customers | Bought within 30 days | Revenue per customer |
|---|---|---|---|
| At risk, contacted | 800 | 14% | 290 |
| At risk, holdout | 200 | 9% | 180 |
In this illustrative case, the campaign added about 5 percentage points of buyers and 110 of revenue per contacted customer. Subtract the cost of the discount and the sending to see whether it paid off. Without the holdout, you'd have credited the campaign with all 14%.
FAQ
How many customers do I need?
It starts to be useful at a few hundred customers with purchases. On small bases, use simple thresholds instead of quintiles.
How is RFM different from cohort analysis?
Cohorts group customers by first purchase date and show retention over time. RFM groups them by current behaviour so you can act now.
Can I do RFM in Google Sheets?
Yes, on a small base, with QUARTILE or PERCENTRANK formulas. For weekly automated refreshes, use SQL.
How do I know RFM campaigns are working?
Hold out a control group within a segment that gets no message, then compare repeat purchase rates after 30–60 days.

DATUMPANEL — Business data analytics
DATUMPANEL is an independent data analyst based in Ukraine. I build dashboards for business owners, set up GA4 and the BigQuery export, and run data pipelines and Telegram auto-reports for e-commerce, service businesses, SaaS and agencies, from data audit to decisions.