SaaS metrics dashboard: MRR, churn and activation in one place
The metrics a SaaS product or mobile app needs (MRR movements, logo and revenue churn, NRR, activation, retention, crash-free users), how to calculate them and where the data comes from.
In SaaS and apps the money arrives every month, so the main question isn't "how much did we sell?" It's "how much recurring revenue do we have, where is it coming from and where is it leaking?" Here's the metric set I build for subscription products, and how to turn it into a dashboard people can read.
Money: MRR and its movements
MRR (monthly recurring revenue) is normalised recurring revenue: annual plans are divided by 12, and one-off payments are left out.
The key move is to break MRR change into components:
| Component | Meaning |
|---|---|
| New MRR | new paying customers |
| Expansion MRR | upgrades, extra seats |
| Contraction MRR | downgrades |
| Churned MRR | cancelled subscriptions |
| Reactivation MRR | customers coming back |
Net new MRR = New + Expansion + Reactivation − Contraction − Churned
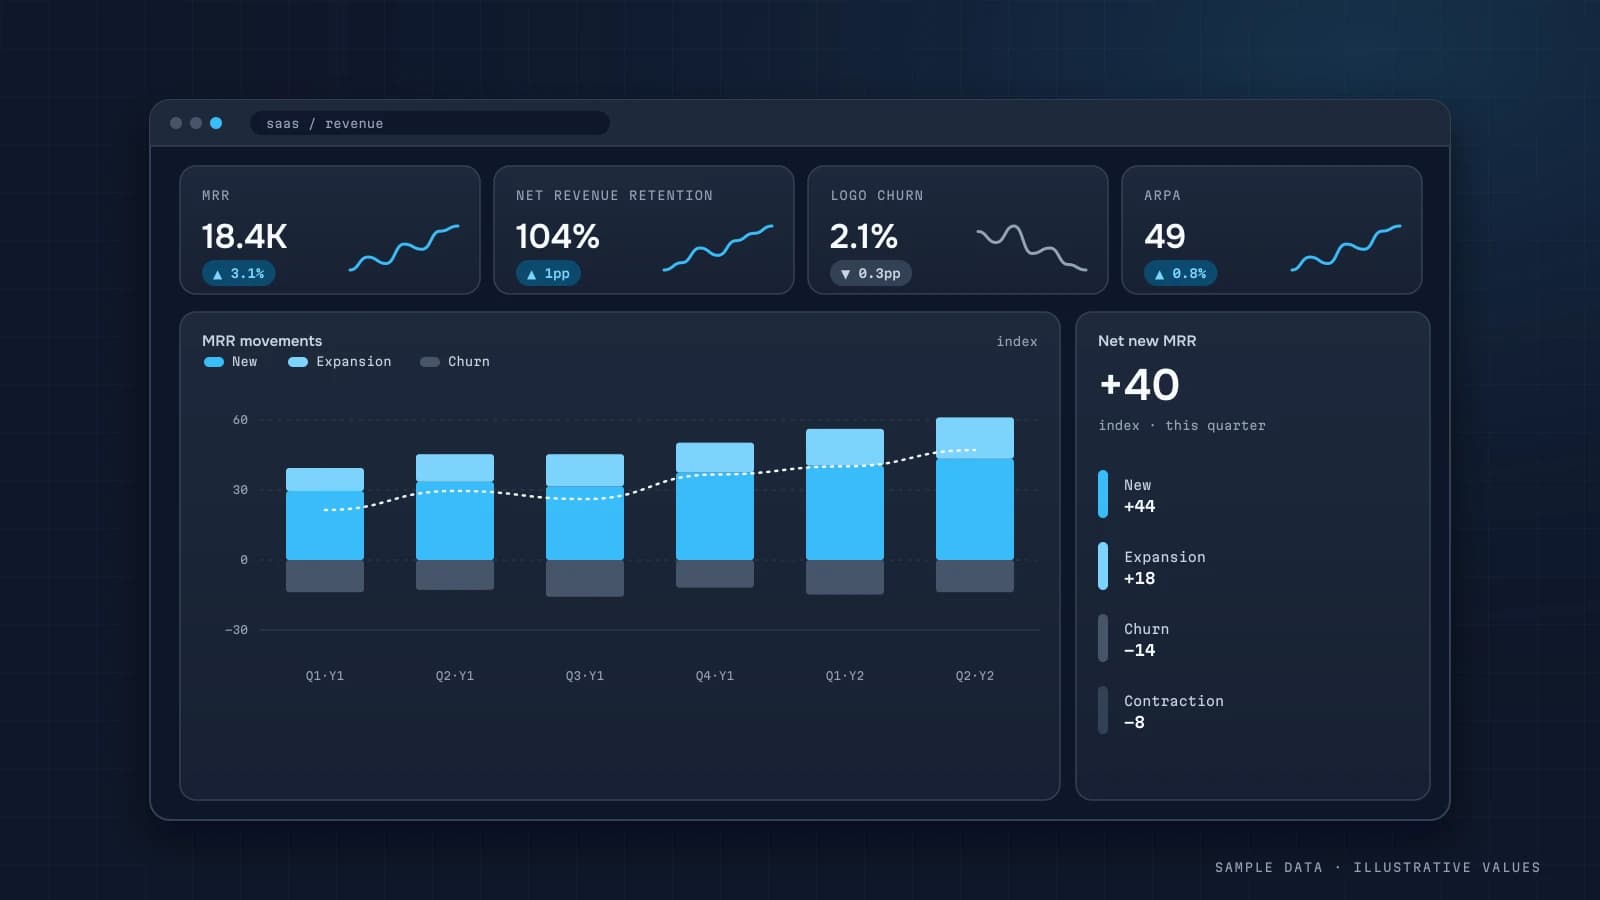
A monthly waterfall of these components is the best chart for the first screen. It shows at a glance whether growth comes from new sales or from fewer people leaving.
Churn: logos and revenue
| Metric | Formula |
|---|---|
| Logo churn | customers cancelled this month / customers at start of month |
| Gross revenue churn | (churned + contraction MRR) / starting MRR |
| Net revenue retention (NRR) | (starting MRR + expansion − contraction − churned) / starting MRR |
NRR above 100% means your existing customers bring in more than they did a month ago, even with zero new sales.
Separate voluntary churn (they cancelled) from involuntary churn (the payment failed). Involuntary churn often responds to dunning emails and card retries, which makes it the cheapest growth you'll find.
Product: activation and retention
- Activation: the share of new users who reach the value moment (first project created, integration connected, onboarding finished) within N days.
- Retention: D1/D7/D30 for apps, weekly or monthly for SaaS (cohort analysis).
- DAU/MAU for stickiness.
- Trial-to-paid conversion by start cohort.
Defining activation is always a product decision. I help find the event after which retention jumps and lock it in as the metric.
App quality
For mobile apps, the money metrics need company:
- crash-free sessions/users by app version;
- top crashes by affected users;
- store ratings and reviews;
- startup time.
When retention drops sharply after a release, the cause is often a new crash on one OS version rather than anything in marketing.
Install attribution
For apps, an MMP such as AppsFlyer decides the install channel. To get CAC and LTV by channel, join MMP data with subscription events. See AppsFlyer attribution.
Data sources
| Data | Source |
|---|---|
| Subscriptions, payments | Stripe, Paddle, App Store / Google Play, or your own billing |
| Behaviour | GA4 / Firebase → BigQuery, or a product analytics tool |
| Installs, attribution | AppsFlyer or another MMP |
| Crashes | Firebase Crashlytics or similar |
| B2B sales | HubSpot, Salesforce |
The data model rests on a single subscriptions table with change history (status, plan, amount, dates). MRR movements, churn and cohorts are all calculated from it.
The first screen of a SaaS dashboard
| KPI | Comparison |
|---|---|
| MRR | vs last month |
| Net new MRR | component waterfall |
| Logo churn % | 6-month trend |
| NRR % | trend |
| New trials and trial→paid | by cohort |
| Activation % | by week |
For apps, add crash-free users and D7 retention. See the SaaS & apps page for an example.
Common mistakes
- Including one-off and setup fees in MRR.
- Counting an annual plan as MRR in the month it was paid.
- Not separating involuntary from voluntary churn.
- Counting "active users" with no precise definition of active.
- Looking at overall churn without cohorts.
Checklist
- MRR is normalised (annual / 12, no one-offs)
- MRR movement is broken into components
- Logo churn and revenue churn are tracked separately
- Involuntary churn is tracked
- An activation event is defined
- Retention is shown by cohort
- Crashes by version sit next to retention
Worked example: an MRR bridge
The single most useful SaaS chart is the MRR bridge: where this month's MRR came from. Illustrative month:
| Component | MRR |
|---|---|
| Starting MRR (1 Sep) | 100,000 |
| + New (first payment this month) | +8,000 |
| + Expansion (upgrades, seats added) | +3,500 |
| + Reactivation (returned after churning) | +700 |
| − Contraction (downgrades) | −1,800 |
| − Churn (cancelled or failed and not recovered) | −4,200 |
| Ending MRR (30 Sep) | 106,200 |
From the same numbers:
- Gross revenue churn = (contraction + churn) / starting MRR = 6,000 / 100,000 = 6.0%
- Net revenue retention (monthly) = (starting + expansion + reactivation − contraction − churn) / starting = 98,200 / 100,000 = 98.2%
- Quick ratio = (new + expansion + reactivation) / (contraction + churn) = 12,200 / 6,000 ≈ 2.0
Some teams count reactivation as new rather than as part of retention. Pick one convention and write it down. Growth of 6.2% looks healthy, but 6% monthly gross churn means you replace most of your revenue base within a year and a half. The bridge makes that visible. A single MRR line doesn't.
SQL: building the bridge from subscription data
WITH m AS (     -- MRR per customer per month, normalised to monthly (annual / 12)
  SELECT customer_id, month, SUM(mrr) AS mrr
  FROM mart.subscription_mrr_monthly GROUP BY 1, 2
),
pairs AS (
  SELECT COALESCE(cur.customer_id, prev.customer_id) AS customer_id,
         COALESCE(cur.month, DATE_ADD(prev.month, INTERVAL 1 MONTH)) AS month,
         IFNULL(prev.mrr, 0) AS prev_mrr, IFNULL(cur.mrr, 0) AS cur_mrr,
         EXISTS (SELECT 1 FROM m h WHERE h.customer_id = COALESCE(cur.customer_id, prev.customer_id)
                 AND h.month < DATE_SUB(COALESCE(cur.month, prev.month), INTERVAL 1 MONTH)) AS had_history
  FROM m cur
  FULL OUTER JOIN m prev
    ON prev.customer_id = cur.customer_id AND prev.month = DATE_SUB(cur.month, INTERVAL 1 MONTH)
)
SELECT month,
  SUM(IF(prev_mrr = 0 AND cur_mrr > 0 AND NOT had_history, cur_mrr, 0)) AS new_mrr,
  SUM(IF(prev_mrr = 0 AND cur_mrr > 0 AND had_history, cur_mrr, 0))     AS reactivation_mrr,
  SUM(IF(prev_mrr > 0 AND cur_mrr > prev_mrr, cur_mrr - prev_mrr, 0))    AS expansion_mrr,
  SUM(IF(prev_mrr > 0 AND cur_mrr > 0 AND cur_mrr < prev_mrr, cur_mrr - prev_mrr, 0)) AS contraction_mrr,
  SUM(IF(prev_mrr > 0 AND cur_mrr = 0, -prev_mrr, 0))                    AS churned_mrr
FROM pairs GROUP BY month ORDER BY month;
Normalise annual plans to monthly (amount / 12) in the source table, and exclude one-off charges (setup fees, add-on credits) from MRR. Otherwise every annual renewal shows up as a spike of "expansion."
Activation: defining the moment that predicts retention
Retention problems usually start in the first days. Define an activation event, the action that best separates users who stay from users who leave, and track the share of new signups who reach it within a fixed window:
- List 5–10 candidate actions (created a first project, invited a teammate, connected a data source, used the core feature 3 times).
- For signups from 3+ months ago, compute day-60 retention for users who did vs didn't do each action within 7 days.
- Pick the action with a large retention gap that a meaningful share of users reach. A rare action with a huge gap isn't actionable.
- Report activation rate weekly by signup cohort and acquisition channel.
This is correlation, not proof that the action causes retention. Treat it as a hypothesis and test onboarding changes against it.
Failed payments: involuntary churn
A part of churn is cards that failed, not customers who left. Separate voluntary (cancelled) from involuntary (payment failed, not recovered) churn. Involuntary churn responds to retries, card-updater services and dunning emails, which makes it often the cheapest churn to reduce. Show recovery rate, the share of failed payments recovered within 14 days, next to it.
Reading the dashboard monthly
A short routine keeps the SaaS dashboard useful instead of decorative:
- Start with the MRR bridge. Which component moved most?
- If churn moved, split voluntary vs involuntary, then by plan and signup cohort.
- If new MRR moved, look at signups, activation rate and trial-to-paid conversion by channel.
- Check net revenue retention by cohort. Is expansion keeping up with churn in older cohorts?
- Write one sentence per finding and one action. Review the actions next month.
FAQ
How do discounts affect MRR?
Use the amount the customer actually pays after the discount. Flag temporary discounts so you can see the MRR lift when they end.
Logo churn or revenue churn: which matters more?
Both. Logo churn reflects customer satisfaction, revenue churn reflects the financial impact. One large account leaving can outweigh dozens of small ones.
How do I get App Store subscription data?
From the store's reports and server notifications, or from a subscription management service. Then map it into the same model as your web subscriptions.
Do I need a separate product analytics tool?
For the core metrics, GA4/Firebase with the BigQuery export is enough. Deep funnel and segment exploration is more comfortable in a dedicated tool.

DATUMPANEL — Business data analytics
DATUMPANEL is an independent data analyst based in Ukraine. I build dashboards for business owners, set up GA4 and the BigQuery export, and run data pipelines and Telegram auto-reports for e-commerce, service businesses, SaaS and agencies, from data audit to decisions.