Skip to content

Solution example · For online stores

Know which products and channels actually make money.

Revenue, margin, conversion and ad payback in one dashboard — every day, without stitching spreadsheets.

E-commerceDesign: Classic
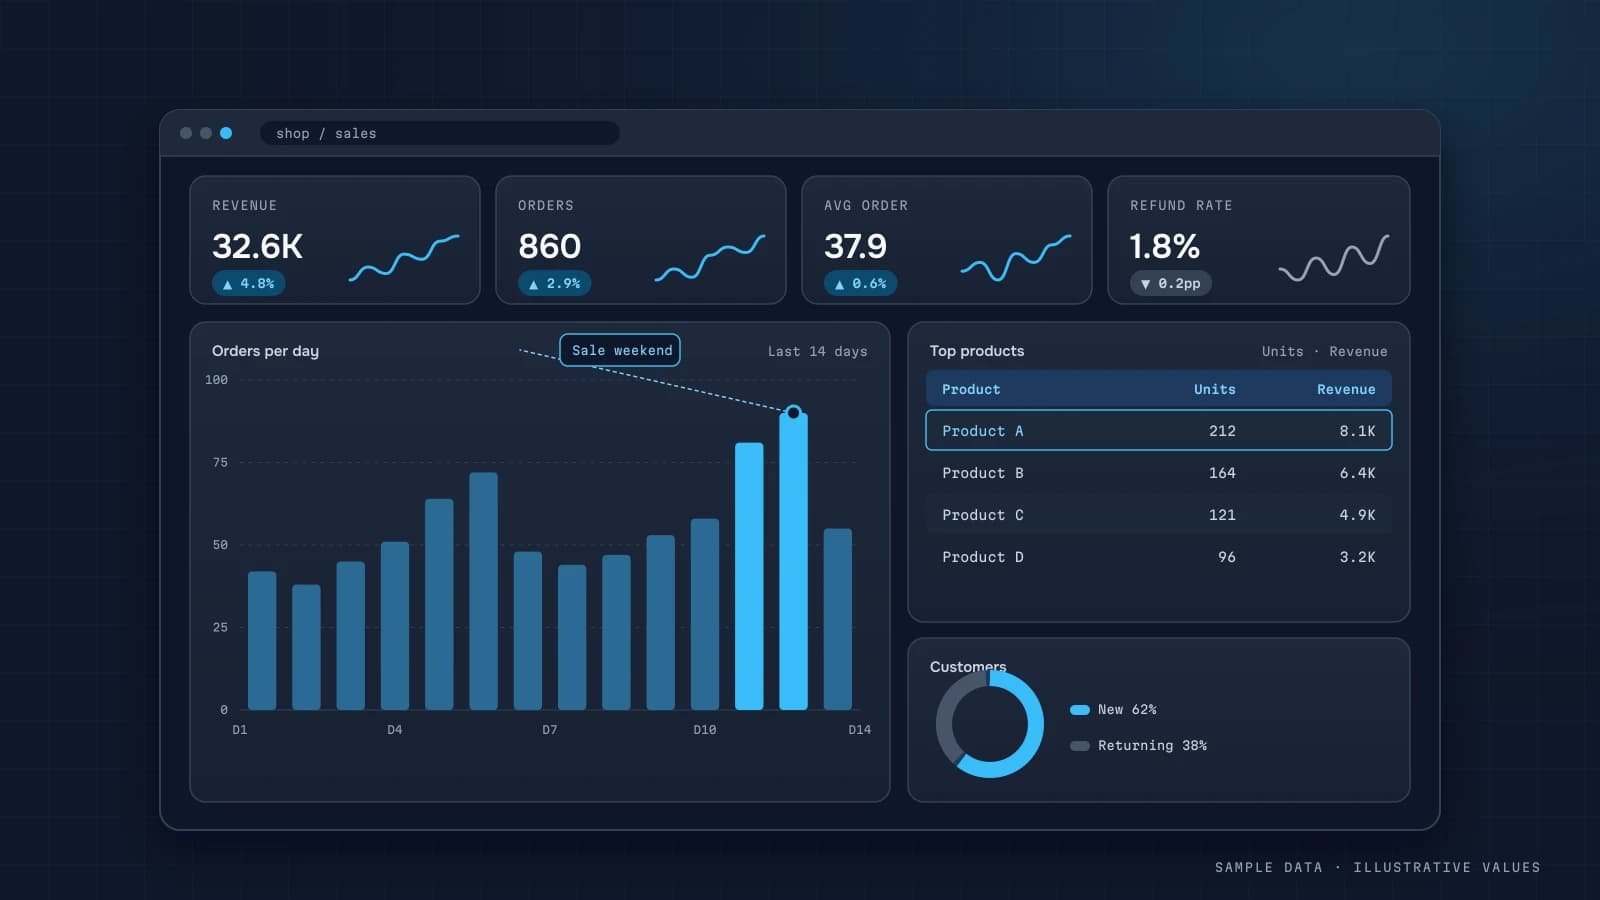
Revenue1.28M ₴12.4%
Orders2,3106.1%
Conversion2.8%0.3 pp
ROAS4.1×8.9%
Daily revenue · ₴This periodPrevious period

ExplainedRevenue has grown four weeks in a row, driven mostly by repeat customers.

Sources
CRMMeta AdsGoogle AdsGA4
Why did conversion dip on Tuesday?
AI agentMobile conversion dropped 18% on Tuesday. Cause: the checkout page on iOS Safari loaded 2.1 s slower, and it accounts for 64% of abandoned carts. Recommendation: check the checkout page performance on iOS.
DATUMPANEL· TelegramnowMorning digestRevenue: +12% vs last weekROAS: 4.1⚠ More abandoned carts on iOS
Try a design · or get a unique style built for your brand
01Call30 min
02Accessread-only
03First versionyour data
04Supportweekly

E-commerce

Sound familiar?

  1. 01

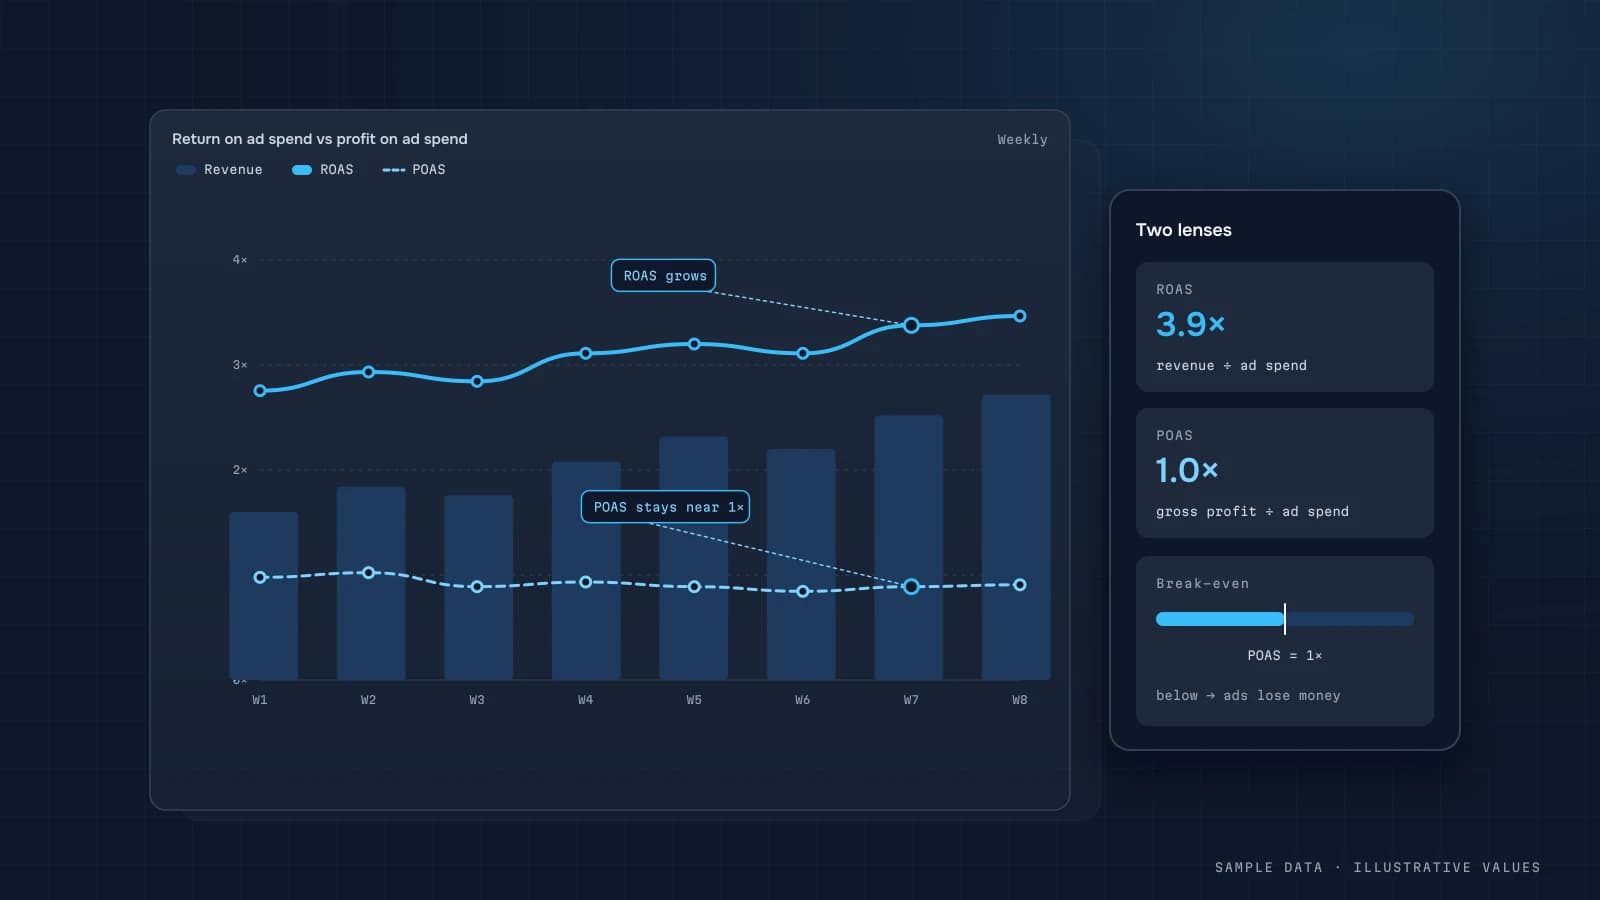
    Every ad account reports its own ROAS

    Meta, Google and marketplaces all count differently, so true payback stays hidden.

  2. 02

    Margin shows up at month-end

    By the time the books are closed, the money is already spent on loss-making SKUs.

  3. 03

    Conversion drops are noticed too late

    A broken mobile checkout can quietly eat sales for a week.

Solution example

What the dashboard shows

A starting set of metrics for this industry. We finalise the list during the audit.

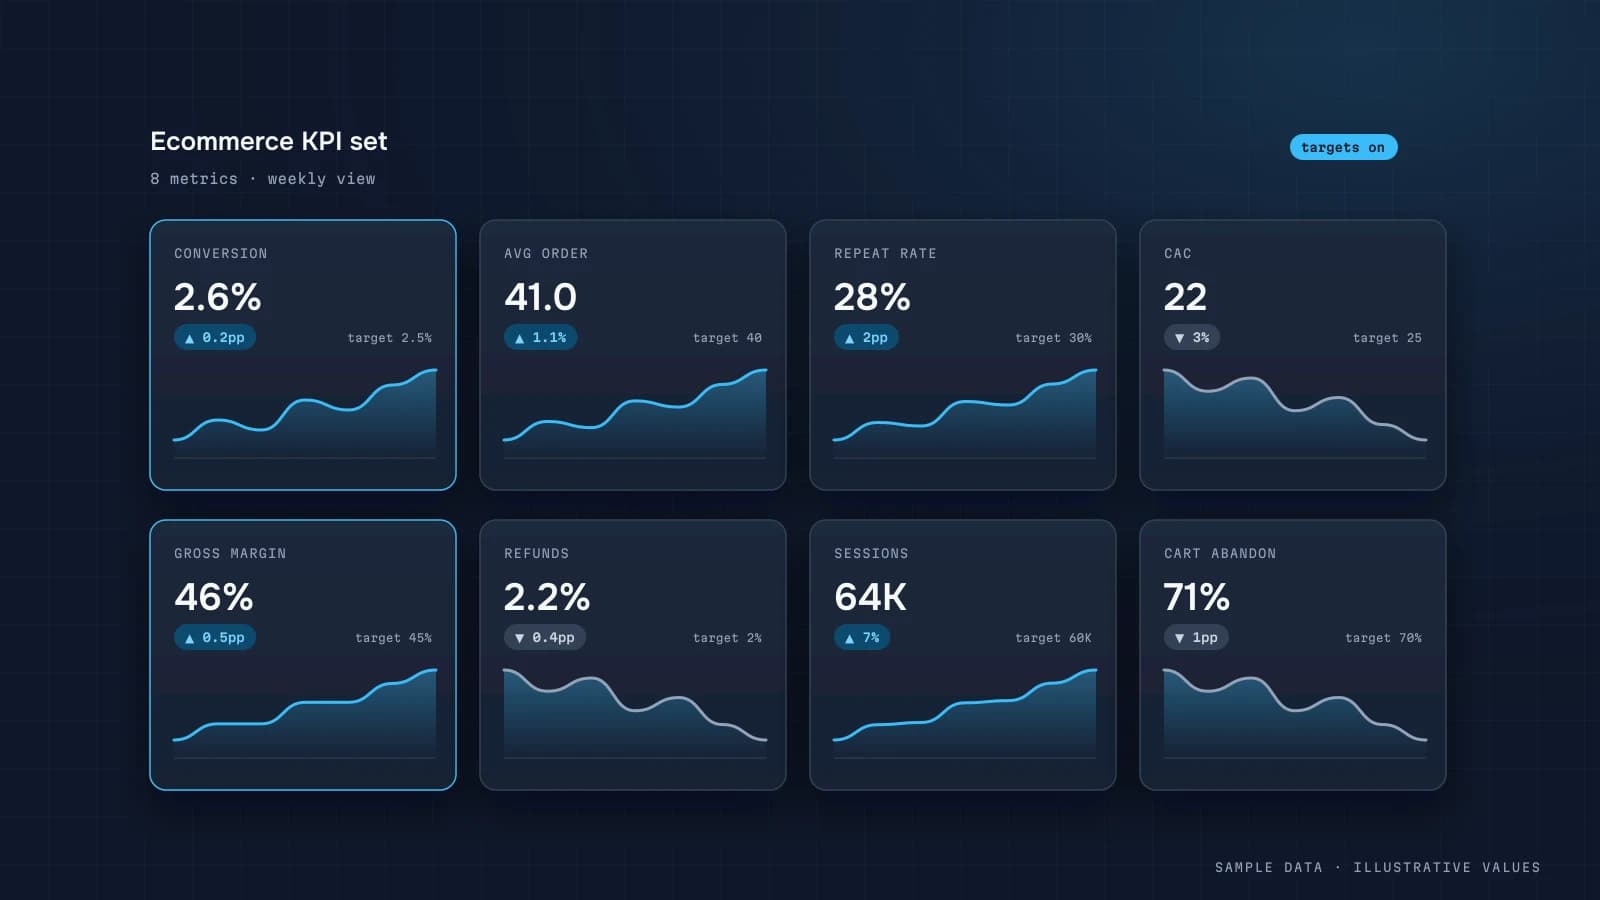
Revenue & average order
by day, channel and category, against plan
Margin
by product and order
Conversion & funnel
from visit to payment, by device
ROAS / CAC
ad payback net of returns
Returns
rate and reasons, by product
Repeat purchases
customer cohorts and LTV

Solution example

Who gets what

  • Owner

    «How much did we make yesterday after ad spend?»

    A morning Telegram digest: revenue, margin, ad spend and the bottom line.

  • Marketer

    «Which campaign should I switch off first?»

    A campaign table with ROAS and margin, sorted worst-first.

  • Category manager

    «What’s going on with frequently returned products?»

    A returns treemap by category plus a list of SKUs with reasons.

Workspace sections you’ll use here

  • Overview

    Headline KPIs compared with the previous period, plus trends.

  • Analytics showcase

    Sales, plan vs actual and 20+ chart types: cohorts, heatmaps, treemaps, waterfalls, maps.

  • Site analytics

    GA4: channels, pages, devices, a geo map, CTA clicks, site search and form funnels.

  • Marketing

    Campaigns, funnel and attribution (AppsFlyer / OneLink), creatives and site click-throughs.

  • AI assistant

    Answers questions about your metrics and explains changes in plain language.

  • Automated reports

    Regular digests in Telegram: daily, weekly or on your own schedule.

Scenario

A home-goods store on a marketplace and its own site

Before

Every Monday the marketer spent an hour matching Meta and Google spend to CRM orders. The accountant shared product margin once a month.

After

Every morning in Telegram: revenue, margin after ad spend and the top 5 loss-making SKUs. Campaigns on those items are paused the same day.

Result

Typical effect: 15–25% less ad spend with no drop in revenue.

A generalised scenario based on typical projects; impact depends on your data.

Sample AI-agent insight

«Why did conversion dip on Tuesday?»

Mobile conversion dropped 18% on Tuesday. Cause: the checkout page on iOS Safari loaded 2.1 s slower, and it accounts for 64% of abandoned carts. Recommendation: check the checkout page performance on iOS.

Sample Telegram report

Morning digest

Revenue: +12% vs last week

ROAS: 4.1

⚠ More abandoned carts on iOS

Typical sources:

  • KeyCRM / Shopify
  • Prom.ua / Rozetka
  • Meta Ads
  • Google Ads
  • GA4
  • 1С / BAS

Plans

Three ways to get started

Start with a micro-dashboard on your spreadsheets, a ready-made template for this industry, or analytics built entirely around your processes.

01Timeline: 1–2 weeks

Lowest-cost start

Micro-dashboard

A static report from your existing data and spreadsheets (Excel, Google Sheets, CSV or a database) — hosted on GitHub Pages or Vercel. A strong fit for entrepreneurs, sole traders and individuals.

  • Excel, CSV or Google Sheets as input
  • 1–3 screens with key charts
  • Static hosting — near-zero running cost
  • Updates on request or on a schedule
02Timeline: 2–4 weeks

Ready-made dashboard

A proven template for your industry, connected to your own data.

  • The key metrics for your industry
  • Plain-language notes on every metric
  • Reports in Telegram
  • Six designs to choose from
03Timeline: 4–8 weeks

Done-for-you analytics

Reports, models and ongoing support built around your questions.

  • Data and metrics audit
  • Any source or API
  • An AI agent trained on your data
  • Regular insights from an analyst

FAQ

The short version

Do you work with Shopify, WooCommerce and marketplaces?

Yes — I connect via API or a scheduled export, whatever fits your stack.

How do you calculate margin?

From cost prices in your accounting system or a spreadsheet; we’ll agree on the formula together.

Can we see sales per sales rep?

Yes, if the CRM has it — as a separate view with plan vs actual.

Read more on the blog

All blog articles →

I’ll show your store in numbers in a single call.

Tell me which systems you use and I’ll prepare a demo on similar data.

Or reach me directly:

Open the demo →

Send a request

I reply within one business day.

What are you interested in
Industry
A few more details · optional
Approximate budget · optional
When to start · optional
Data sources you have · optional

By submitting, you agree to the Privacy policy — your contact details are used only to reply to this request.