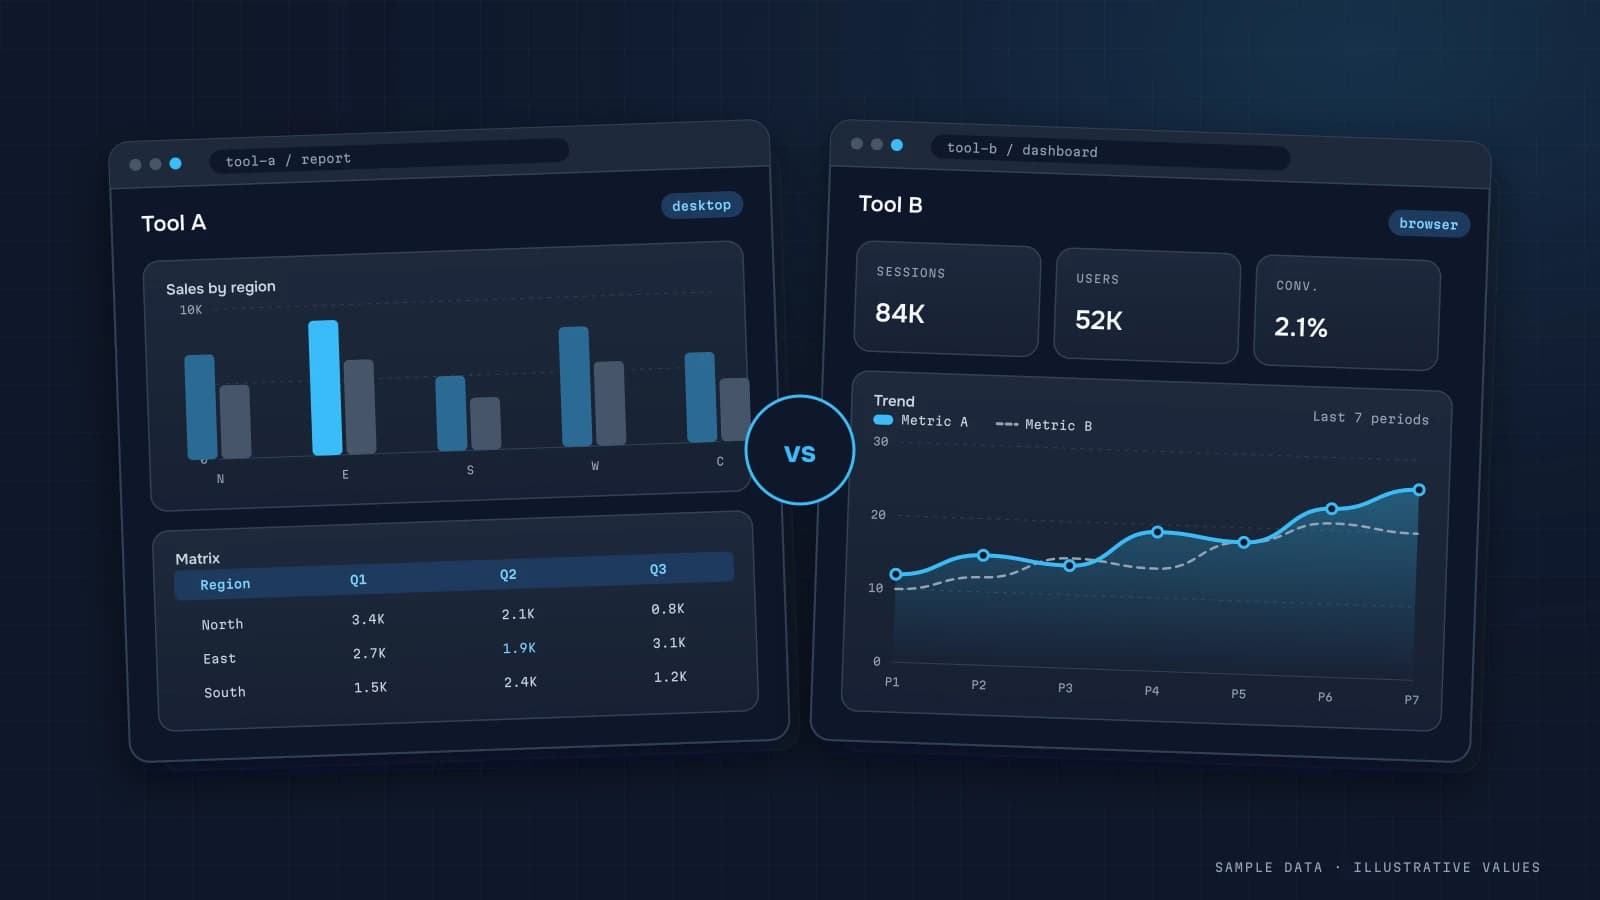
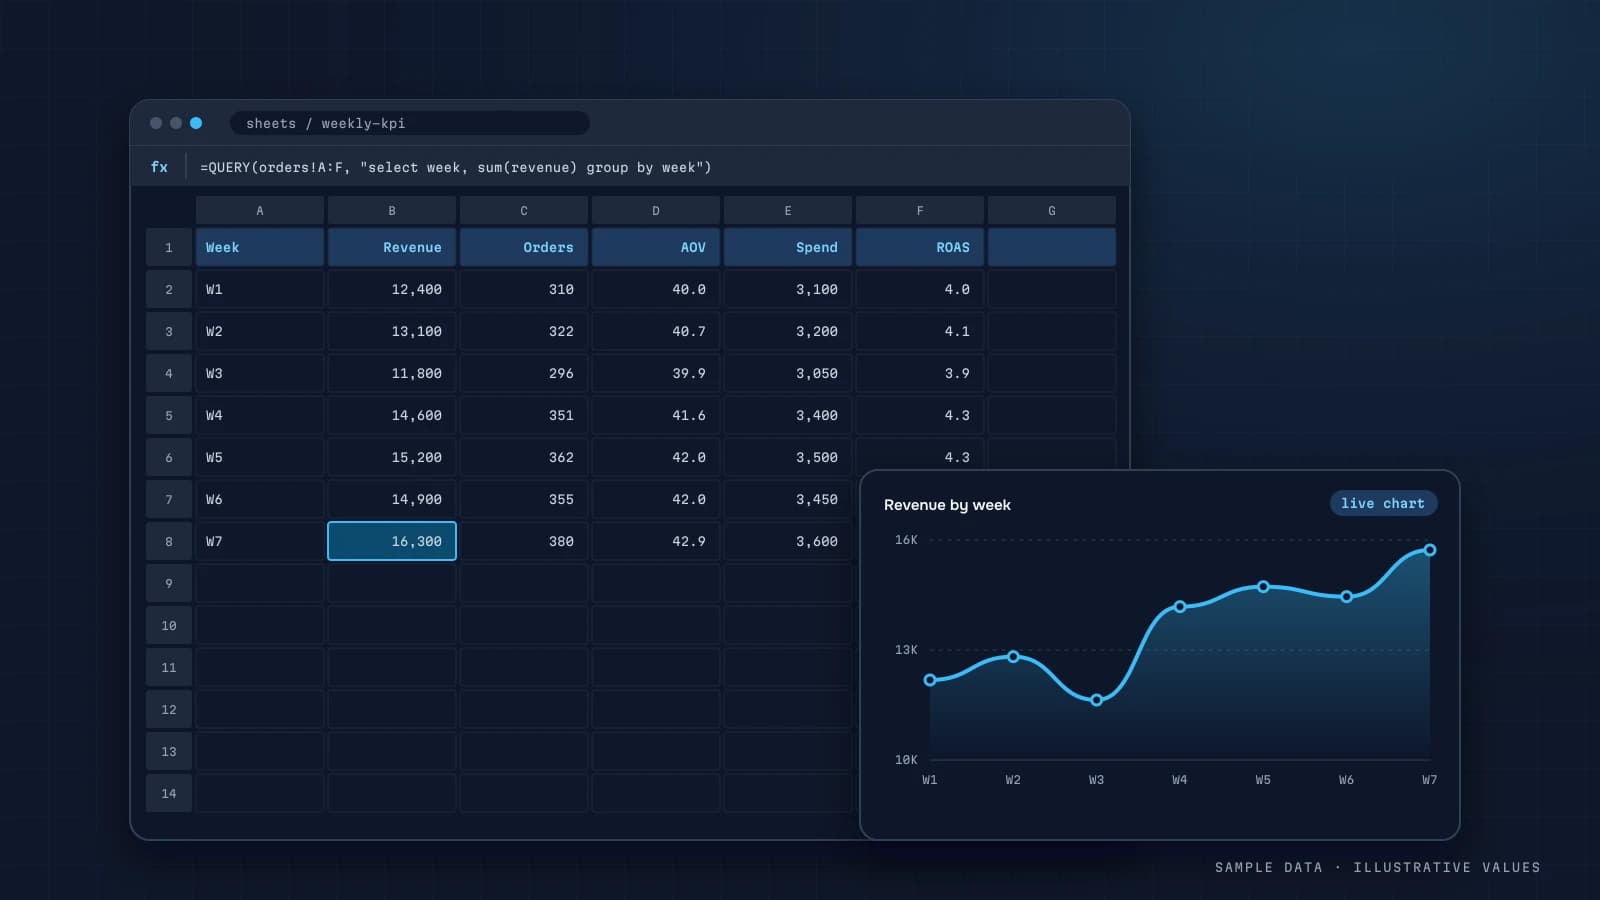
Custom dashboard vs BI tool: which one actually pays off
An honest comparison of a custom analytics workspace with Power BI, Looker Studio or Metabase, covering total cost of ownership, licences, branding, metric explanations, chat reports, self-hosting, and when BI clearly wins.
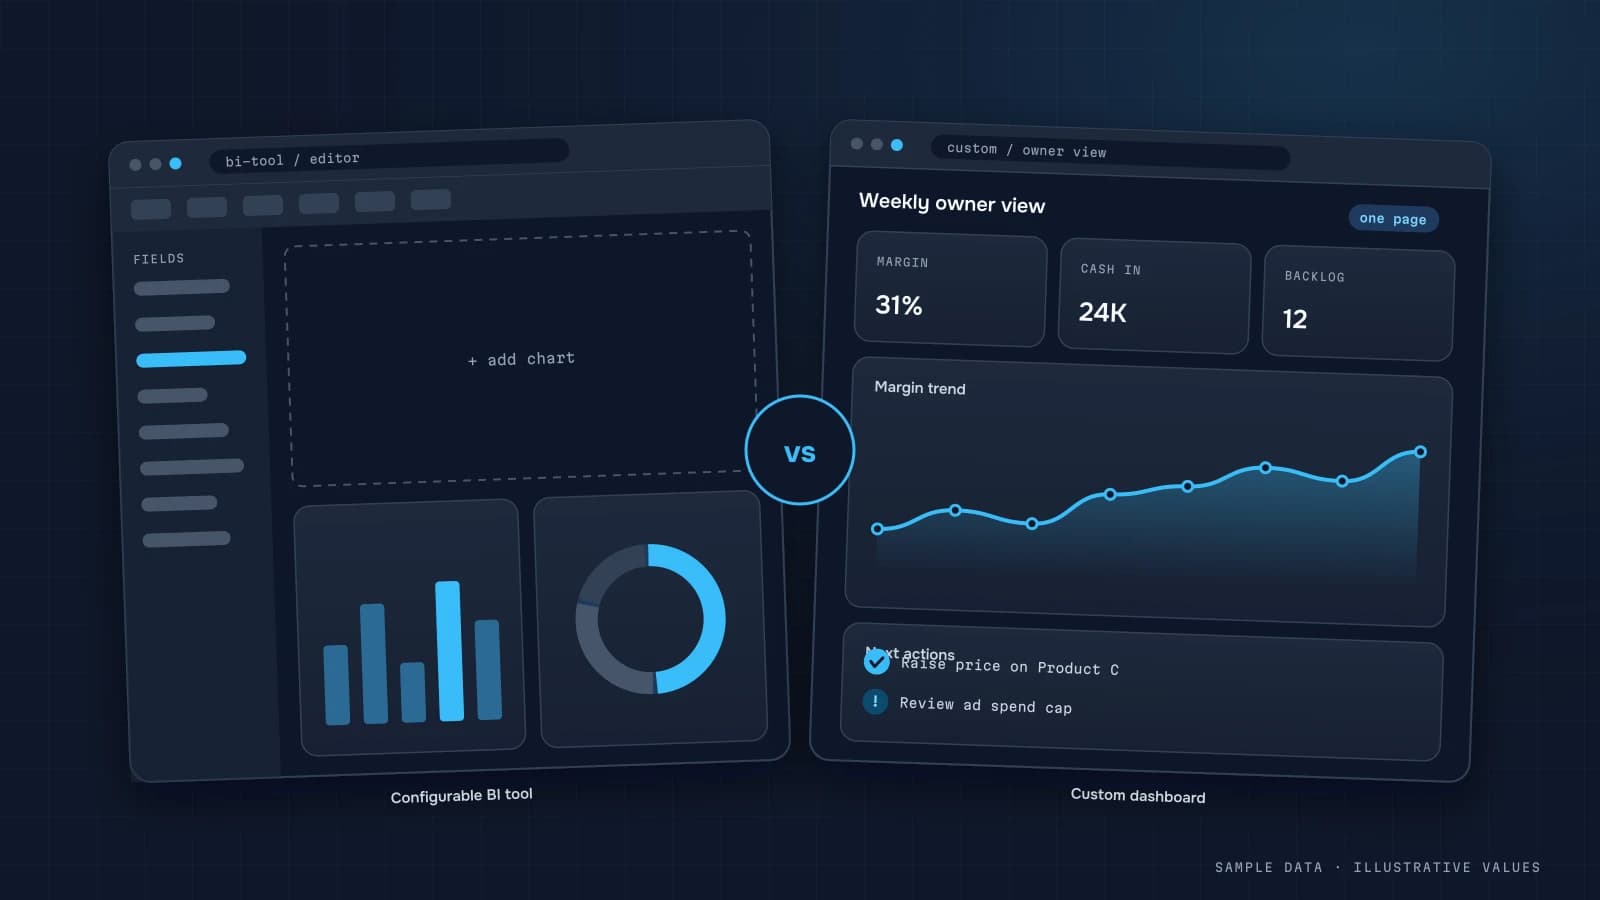
I build custom analytics workspaces for a living, which is exactly why I should be upfront about when you don't need one. These are the criteria I use to recommend either a BI tool or a custom dashboard.
What a "custom workspace" means
It's a web app on your own domain (say analytics.yourcompany.com) that reads your data warehouse and shows screens designed in advance: KPIs with explanations, charts, tables, chat reports, role-based access and an AI assistant. You own the code and the data, and it runs on your server or cloud.
A BI tool (Power BI, Looker Studio, Tableau, Metabase) is a general-purpose builder where you assemble reports out of ready-made blocks.
Side by side
| Criterion | Custom workspace | BI tool |
|---|---|---|
| Users | non-technical: founders, managers, clients | analysts and power users |
| Ad-hoc drag-and-drop analysis | limited | the core strength |
| Licences | none per user | often per author/viewer |
| Brand, domain, design | fully yours | limited |
| Metric explanations in the UI | built in | added by hand in text boxes |
| Chat reports and alerts | built in | usually via add-ons |
| AI assistant on your data | can be set up | depends on tier and ecosystem |
| Self-hosting | yes | partly (Metabase, Tableau Server, Power BI RS) |
| Speed of change | needs a developer | an analyst can change things in minutes |
| Up-front cost | higher | lower |
When a BI tool is better
- You have an analyst who slices data every day and keeps building new views.
- You need free-form drag-and-drop analysis, not a fixed set of screens.
- The company already lives in Microsoft 365 or Google Workspace and has the licences.
- Reports change often, and there are many of them.
- Your starting budget is minimal and your data is mostly in the Google ecosystem, in which case Looker Studio is a sensible first step.
The tools themselves are compared in Power BI vs Looker Studio vs Metabase.
When a custom workspace is better
- The dashboard is for non-technical people who need six KPIs and an explanation of why they moved.
- There are many viewers (managers, franchisees, agency clients), and per-seat licences get expensive.
- Branding matters, because clients see the dashboard as part of your product.
- You want chat reports, alerts and roles out of the box.
- The data has to stay on your own server.
- The metric set is stable and changes quarterly, not daily.
Calculating total cost of ownership
Don't compare start-up prices. Compare the cost over 2–3 years:
| Item | Custom workspace | BI tool |
|---|---|---|
| Build / setup | higher, one-off | lower |
| Licences | none | × users × months |
| Infrastructure | server, warehouse | warehouse, maybe paid connectors |
| Maintenance | analyst hours per month | analyst hours per month |
| Changes | via a developer | faster in-house |
You need the pipeline and the warehouse either way, and that shared foundation is where most of the work goes (data pipelines). Switching approaches later doesn't mean starting over.
A hybrid often works best
What I often end up building:
- a custom workspace for founders, managers and clients (fixed screens, chat reports, roles);
- Metabase or Looker Studio on the same warehouse, for the analyst who wants freedom;
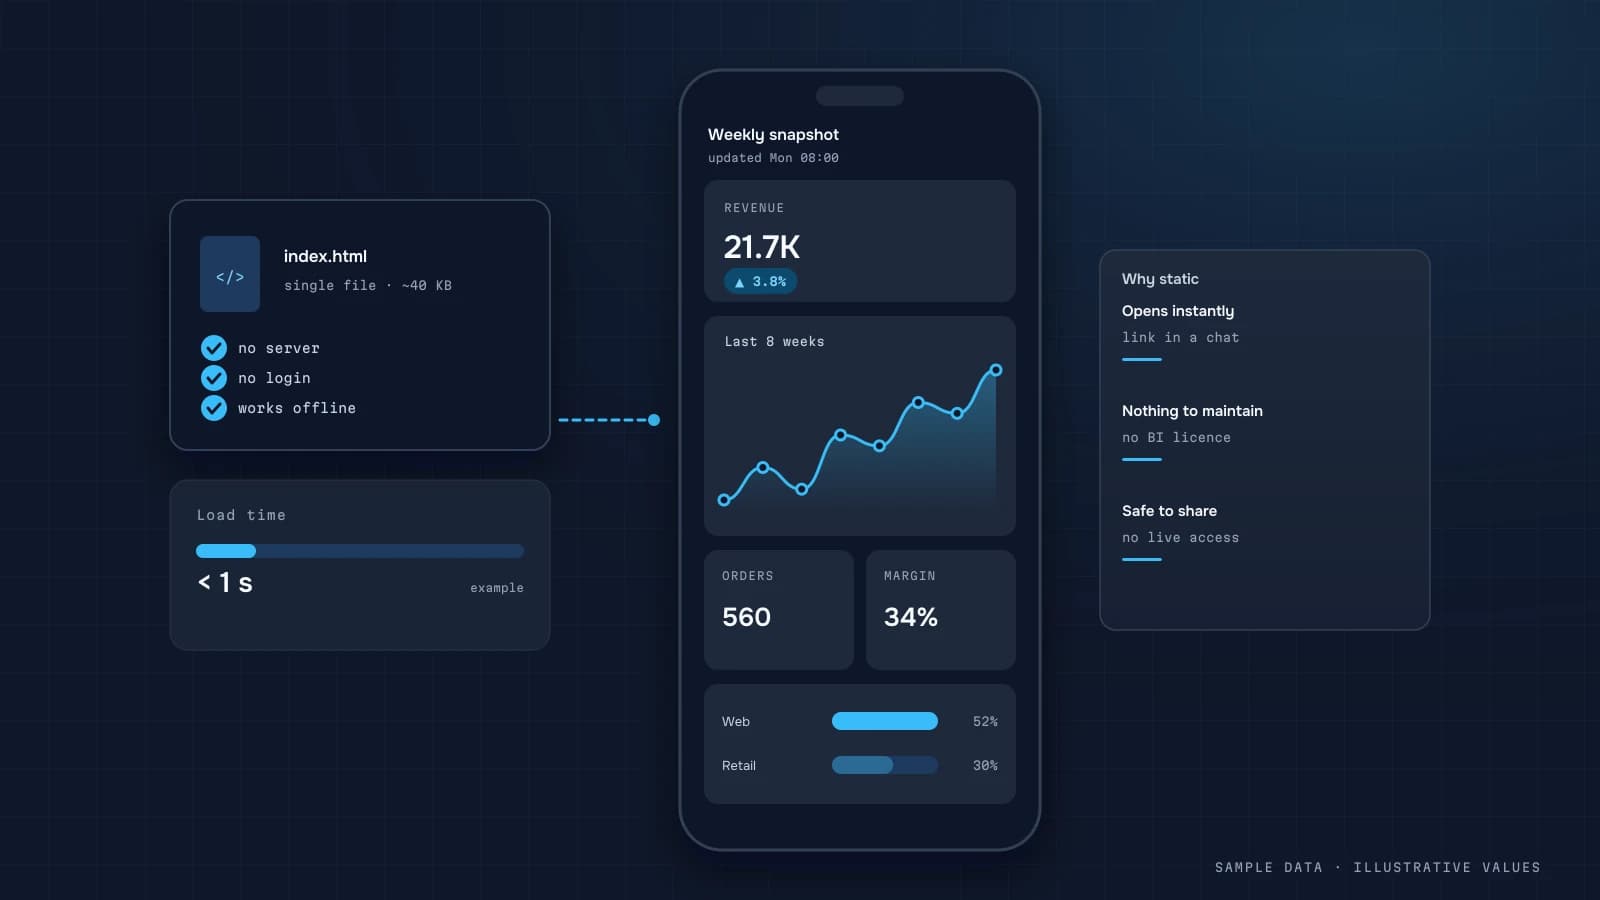
- static micro-dashboards for one-off reports to investors or partners.
Questions to ask yourself
- Who will open the dashboard every day, an analyst or the founder?
- How many people will have access a year from now?
- Will clients see it?
- Do you need reports in a messenger?
- Where must the data live?
- How often do the metrics change?
If the answer to 1 is "an analyst" and to 6 is "daily," go with BI. If it's "the founder," "lots of people" and "yes, clients," consider a custom workspace. More arguments are on the comparison page.
Worked example: three-year cost for a 10-person team
An illustrative comparison. Replace every number with your own quotes and hourly rates:
| Line (3 years) | BI tool (per-user licences) | Custom workspace |
|---|---|---|
| Setup: data pipeline and warehouse | 60 h | 60 h |
| Setup: dashboards / application | 40 h | 160 h |
| Licences: 10 viewers × 36 months × L | 360 L | 0 |
| Hosting | 0 | 36 × H |
| Maintenance: 6 h/month vs 8 h/month | 216 h | 288 h |
| Changes and new screens: 4 h/month | 144 h | 144 h |
The pipeline costs the same either way, because that's where most of the real work is. The difference comes down to licences against extra build and maintenance hours. With few viewers and simple needs, the BI tool wins easily. With many viewers (for example clients of an agency, or a whole sales team), or with needs a BI tool handles awkwardly (custom logic, embedded actions, white-label), licences grow linearly while a custom workspace's costs barely move. Calculate the break-even point for your viewer count instead of trusting a general rule.
Step by step: deciding in a week
- Write down the 10 questions the dashboard must answer and who asks each.
- List hard requirements: number of viewers in 12 months, external access, row-level permissions, mobile use, embedding, actions (approving, commenting, exporting to the accounting system).
- Build the main screen in a BI tool on your real data. Two or three days is enough to hit the limits.
- Note every workaround you needed. One or two is normal. If the list keeps growing, that's your answer.
- Run the cost table above with real quotes.
- Decide where the logic lives. Whatever you choose, keep metric definitions in SQL in the warehouse, so the presentation layer can change later.
Signs you've outgrown the BI tool
| Signal | Example |
|---|---|
| Workarounds pile up | calculated fields that duplicate warehouse logic, blends that time out |
| Licence cost tracks headcount | every new salesperson or client adds a seat |
| Users ask for actions, not views | "let me mark this lead as checked here" |
| Branding and embedding matter | clients should see your product, not the tool's interface |
| Performance on the main screen | loads take tens of seconds on a year of data |
Signs a custom workspace is the wrong call
- Nobody will maintain it after launch. A BI tool degrades gracefully; custom code without an owner doesn't.
- Requirements are still changing weekly. Prototype in a BI tool first and build custom once the screens settle.
- The data isn't clean yet. A custom front end on messy data is just a prettier way to show wrong numbers. Fix the pipeline first.
The hybrid that often works
Many teams end up with both: a BI tool for the analyst's exploration and ad-hoc questions, and a small custom workspace (or a static micro-dashboard) for the handful of screens that everyone opens daily. Both read the same warehouse tables, so numbers match and neither layer locks you in.
FAQ
Can we start with BI and move to a custom workspace later?
Yes. If the data already sits in a warehouse, the move is just new screens on top of the same tables.
Who maintains a custom workspace after launch?
I support projects on retainer if you want that. The code and docs are yours, so any developer can maintain it.
Can users export to Excel?
Yes. Every table exports to CSV with the current filters applied, and pages can be exported as PDF or images.
How is it different from Looker Studio with a nice template?
Roles and access control, metric explanations, chat reports, an AI assistant and your own branding, all running on your data in your infrastructure with no API quotas.

DATUMPANEL — Business data analytics
DATUMPANEL is an independent data analyst based in Ukraine. I build dashboards for business owners, set up GA4 and the BigQuery export, and run data pipelines and Telegram auto-reports for e-commerce, service businesses, SaaS and agencies, from data audit to decisions.