Google Sheets dashboards: when they're enough and where they break
How to build a working dashboard in Google Sheets (sheet structure, QUERY, IMPORTRANGE, pivots, sparklines) and the signs that it's time to move to a warehouse and a proper dashboard.
Google Sheets is the first BI tool most small businesses use, and that's fine. It's free, everyone understands it, and it's the fastest way to find out which metrics you actually need. The trouble starts when the spreadsheet grows and the whole team expects it to act like a dashboard.
Building a spreadsheet dashboard properly
Sheet structure
| Sheet | Contents | Who edits |
|---|---|---|
raw_orders | order export as-is | automated, or manual by a fixed rule |
raw_ads | spend by day and channel | automated |
dict | lookups: channels, categories, COGS | analyst |
calc | calculations, formulas | analyst |
dashboard | KPIs and charts | nobody (view only) |
The key rule: raw data, calculations and visuals go on separate sheets. Protect the dashboard sheet from edits.
Useful functions
QUERY, for SQL-like selects inside the sheet:
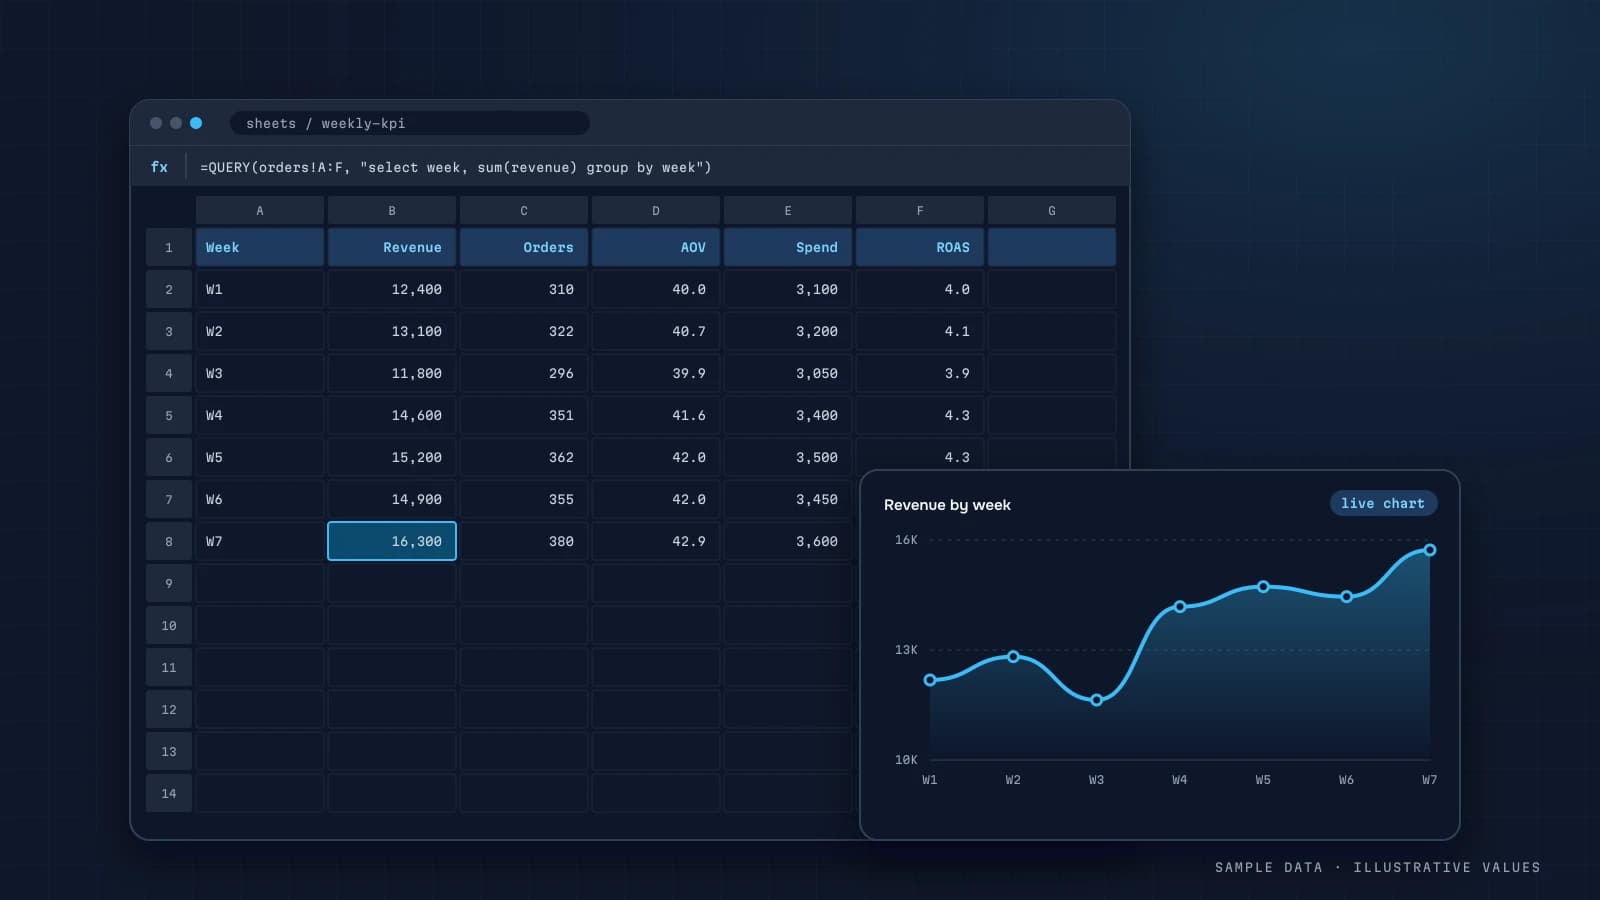
=QUERY(raw_orders!A:F, "select B, sum(E) where D = 'paid' group by B label sum(E) 'Revenue'", 1)IMPORTRANGE, to pull from another file (the finance team's plan, for example);SUMIFSandCOUNTIFS, for KPIs filtered by period;SPARKLINE, for a mini trend chart next to each KPI;- pivot tables, for cohorts and breakdowns;
- data validation dropdowns, so nobody types "Insta" instead of "instagram".
Automation
- scheduled exports from your CRM or store via Apps Script or integration tools;
- Google Ads has official ways to export reports into Sheets;
- lead forms can write straight into a sheet.
When a spreadsheet is enough
- one or two data sources;
- up to a few thousand rows a month;
- one or two people working with the numbers;
- daily refresh or less;
- metrics are still taking shape and change often.
In that situation a sheet is the fastest way to test your metric dictionary before you build anything heavier (business dashboard guide).
Signs it's time to move on
| Symptom | What's happening |
|---|---|
| The file takes a minute to open | volume and formulas have outgrown the tool |
| "My copy says something different" | several versions of the truth |
| Someone broke a formula by accident | no change control |
| Copy-paste every Monday | no automated pipeline |
| You need to join CRM, ads and GA4 | complex joins in sheets are fragile |
| You need roles or client access | a sheet is all-or-nothing |
| Cell limits and slow IMPORTRANGE | hard technical limits |
Google Sheets caps the number of cells per file, and heavy IMPORTRANGE and QUERY formulas slow things down long before you reach that cap.
Moving on without pain
- Keep the sheet for manual lookups like targets, COGS and goals. That's what it does best.
- Move raw data into a warehouse (BigQuery or PostgreSQL) with automated loads (pipelines).
- Move the calculations into SQL. Same logic, now under version control.
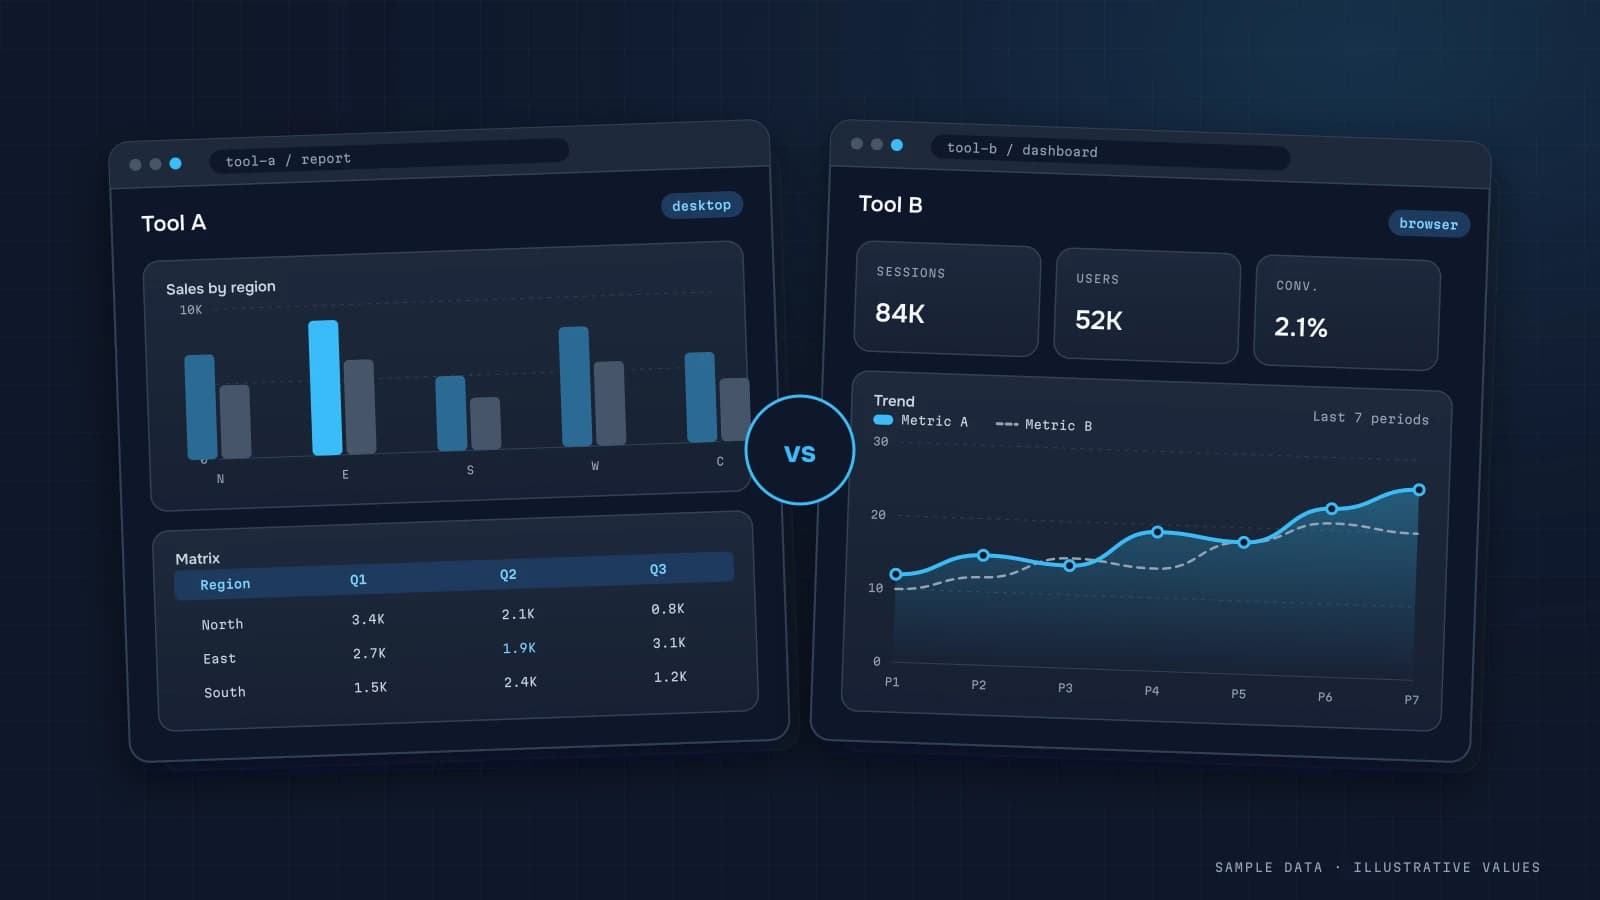
- Build the dashboard in Looker Studio, Metabase or a custom workspace (tool comparison).
- Have the pipeline read the lookup sheet nightly, with validation.
A halfway option is Looker Studio on top of Sheets. You get nicer charts and view-only access, but it doesn't fix speed or fragility. For a one-off report on finished tables, a static micro-dashboard also works well.
Common mistakes
- Formulas and manual input on the same sheet.
- Merged cells in raw data, which break QUERY and pivots.
- Dates stored as text in mixed formats.
- Dozens of chained IMPORTRANGE calls between files.
- Edit access for everyone.
Checklist
- Raw data, calculations and dashboard on separate sheets
- Dashboard sheet protected
- Lookups use data validation
- Dates stored as dates, numbers as numbers
- Exports are automated
- "Last updated" shown on the dashboard
- You know which signs mean it's time to move on
Step by step: a weekly sales dashboard in Sheets
A structure that stays maintainable, illustrated for a small store:
Sheet 1, raw_orders. One row per order, pasted or imported, never edited by hand: date, order ID, channel, revenue, cost, status.
Sheet 2, raw_spend. Date, channel, spend.
Sheet 3, calc. Weekly aggregates with formulas only:
A2: =QUERY(raw_orders!A:F,
     "select year(A), week(A), C, count(B), sum(D), sum(D)-sum(E)
      where F = 'paid'
      group by year(A), week(A), C
      label count(B) 'orders', sum(D) 'revenue', sum(D)-sum(E) 'margin'", 1)
Week numbering in QUERY is its own convention. For Monday-based weeks, add a helper column in raw_orders with =A2-WEEKDAY(A2,3) (the Monday of that week) and group by it instead.
Sheet 4, dashboard. Only references to calc, KPI cells, and charts. No raw data, no complex formulas.
Pulling data from another file:
=IMPORTRANGE("https://docs.google.com/spreadsheets/d/<file-id>", "orders!A:F")The first time, you'll need to allow access between the files. See Google's help on IMPORTRANGE and QUERY.
KPI cells with comparisons
Revenue this week:   =SUMIFS(calc!E:E, calc!B:B, this_week)
Revenue last week:   =SUMIFS(calc!E:E, calc!B:B, this_week-7)
Change:              =IFERROR(B2/B3-1, "")
Arrow:               =IF(B4>=0, "▲ "&TEXT(B4,"0%"), "▼ "&TEXT(-B4,"0%"))
Use named ranges (this_week) instead of hard-coded cell references, so the dashboard keeps working when rows move.
Worked example: when the spreadsheet hit its limit
An illustrative path that's common in practice:
| Month | Rows in raw_orders | What happened |
|---|---|---|
| 1 | 2,000 | dashboard built, opens instantly |
| 6 | 14,000 | IMPORTRANGE from two files; first "Loading…" delays |
| 9 | 25,000 | a manager sorted raw_orders by hand; formulas pointed at wrong rows for a week before anyone noticed |
| 12 | 40,000 + ad data from three platforms | opening takes over a minute; weekly copy-paste of ad data takes 2 hours |
At month 9 the problem was integrity, not size: anyone with edit access can break raw data. At month 12 it was both. Moving the raw data to a database or BigQuery with automatic loads, and keeping Sheets (or Looker Studio) as the view, fixed both. Google Sheets can also query BigQuery directly through Connected Sheets, a gentle middle step.
Protecting a spreadsheet dashboard
- Raw-data sheets are protected (Data → Protect sheets and ranges), editable only by the importer
- Viewers get view or comment access, not edit
- Version history is used before big changes ("File → Version history → Name current version")
- A visible "last updated" cell, filled by the import, not typed
- One owner who approves structural changes
Charts in Sheets: practical tips
- Build charts on the
calcsheet's fixed ranges, not on whole columns of raw data. Charts on open-ended ranges slow the file down and pick up stray rows. - Use sparklines for KPI trends.
=SPARKLINE(calc!E2:E13)in a cell next to each KPI gives a 12-week trend with no chart object to maintain. - Keep one chart per question. A combo chart with revenue bars, a margin line and a spend line on two axes is hard to read; two simple charts side by side aren't.
- Fix the axis range on charts compared week to week, or the same change will look dramatic one week and flat the next.
- Mind the colours. The default palette changes series colours when you add a series. Set them explicitly so "Meta" is always the same colour.
Sharing the result
For owners who don't want to open a spreadsheet, publish just the dashboard sheet as a link or embed (File → Share → Publish to web lets you choose a single sheet; be careful, since published content is public to anyone with the link), or export the dashboard sheet as a PDF to email on a schedule with a simple Apps Script trigger. For anything confidential, share with named accounts instead of publishing.
FAQ
Can a Google Sheets dashboard look good?
It can be properly functional: KPIs, SPARKLINE and a few charts. For interactive filters and a nicer look, connect the sheet to Looker Studio.
How do I refresh data automatically?
With time-triggered Apps Script, official add-ons or integration tools. Keep API keys in script properties, never in cells.
How many rows can a sheet handle?
The hard limit is cells per file. The practical limit arrives much earlier, when formulas start to lag. For thousands of orders a month and years of history, use a database.
Can a custom workspace read from Google Sheets?
Yes, as a lookup source for things like targets and COGS. The pipeline reads it on a schedule and validates it.

DATUMPANEL — Business data analytics
DATUMPANEL is an independent data analyst based in Ukraine. I build dashboards for business owners, set up GA4 and the BigQuery export, and run data pipelines and Telegram auto-reports for e-commerce, service businesses, SaaS and agencies, from data audit to decisions.