
Product
The DATUMPANEL workspace: all your business data on one screen.
A ready-made analytics workspace I configure around your data: KPIs with explanations, charts, sortable tables, an AI assistant and Telegram reports.

Product
What’s inside
The sections of the workspace. I switch on only the ones you need.
Overview
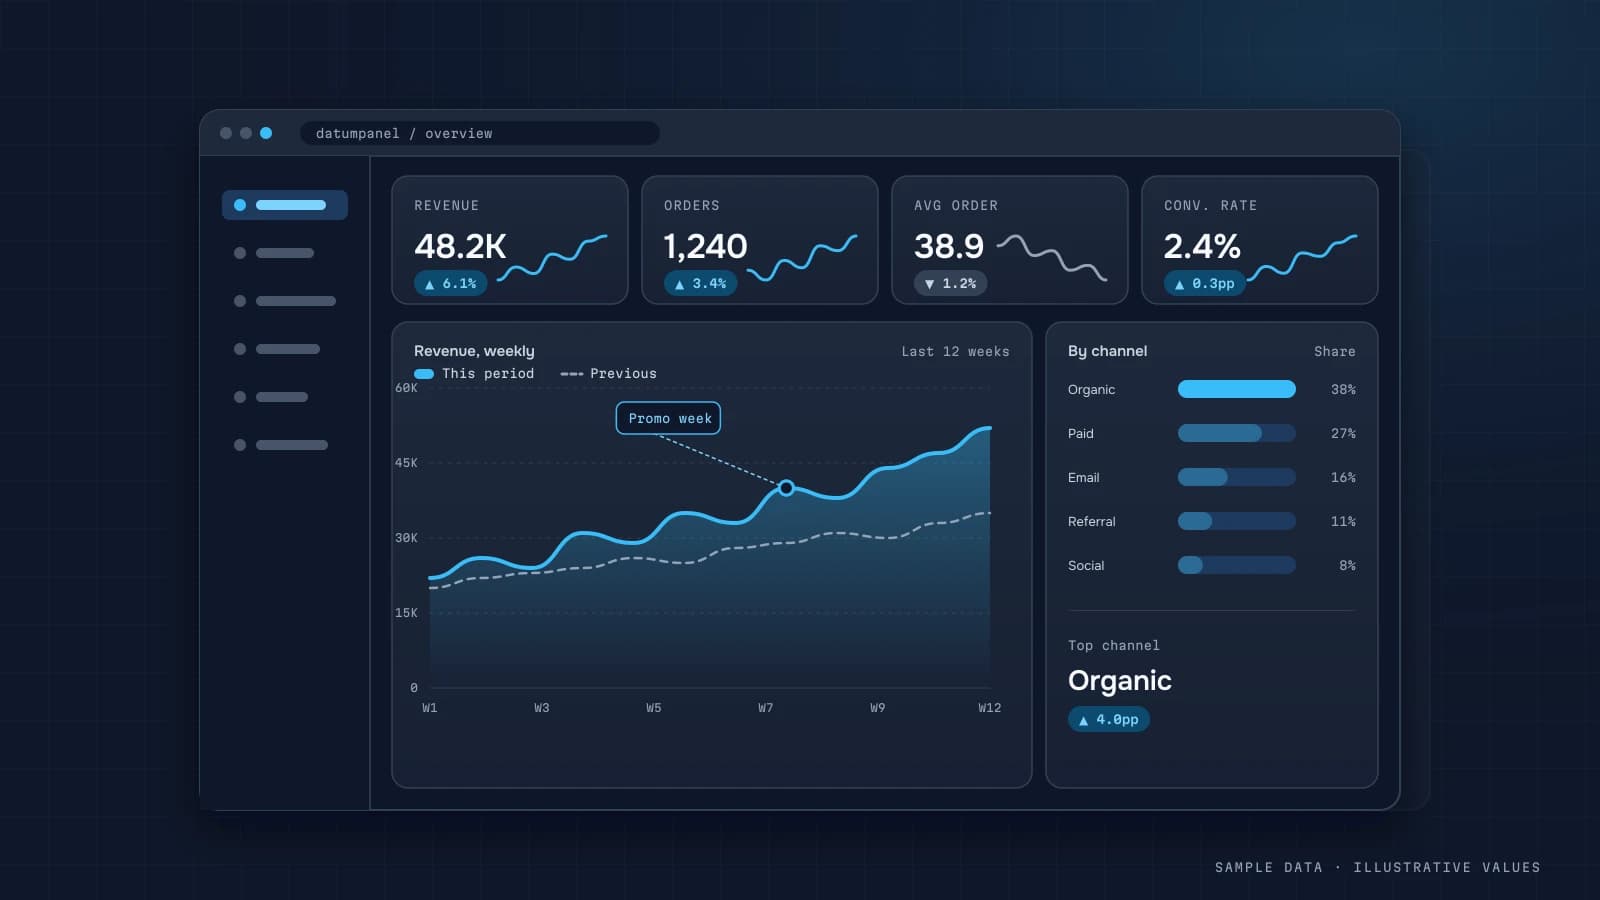
Headline KPIs compared with the previous period, plus trends.
- A note on every metric
- Preset and custom periods
- Saved filter views
Analytics showcase
Sales, plan vs actual and 20+ chart types: cohorts, heatmaps, treemaps, waterfalls, maps.
- Plan vs actual per KPI
- Anomalies and a ±2σ band
- Order and product tables
Site analytics
GA4: channels, pages, devices, a geo map, CTA clicks, site search and form funnels.
- Form funnel
- CTA zones and categories
- Visitor map
Search analytics
Google Search Console: clicks, impressions, CTR and position by query, page and device.
- Queries and pages
- Position trend
- Device breakdown
Marketing
Campaigns, funnel and attribution (AppsFlyer / OneLink), creatives and site click-throughs.
- Sortable campaign table
- Click-to-action funnel
- Source and channel filters
Users
DAU, sessions, sign-ups and audience activity.
- DAU / sessions / sign-ups
- Period comparison
Screen analytics
User paths between app screens, a Sankey diagram and a screen table.
- Flow Sankey
- Top paths
Devices & platforms
iOS / Android / web, device models and audience split.
- Platforms
- Devices from search
Crashes
Firebase Crashlytics: crash trend, top issues, platforms and affected users.
- Top issues
- Platform breakdown
My dashboards
Custom dashboards built from ready-made widgets — for a specific role or client.
- Widget-based builder
- A dashboard per role
AI assistant
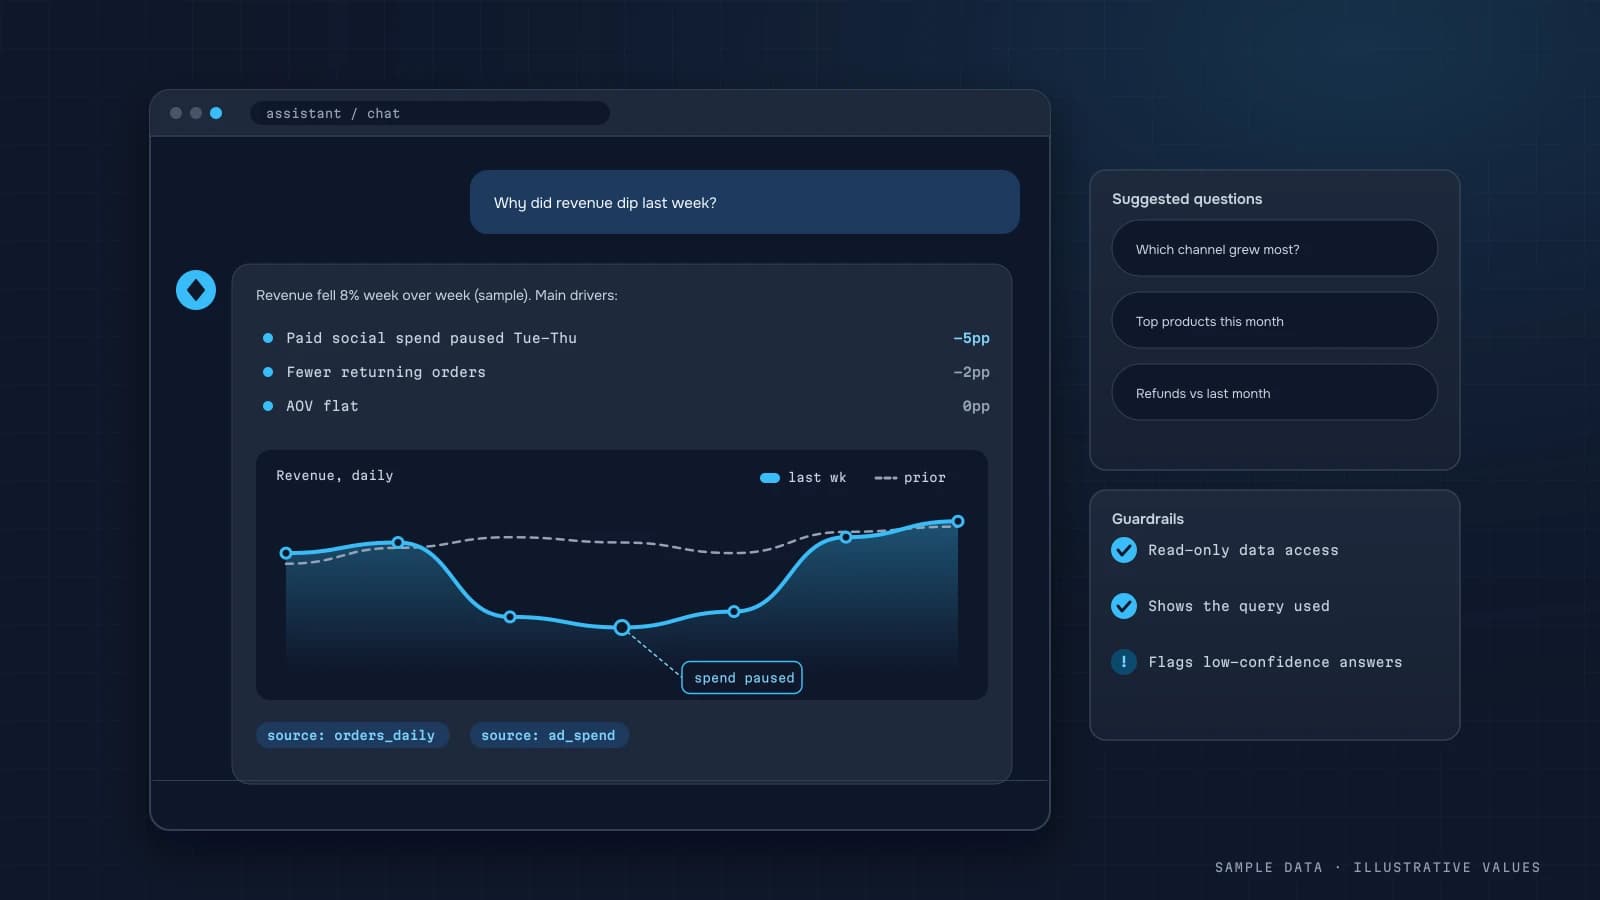
Answers questions about your metrics and explains changes in plain language.
- Knows your metrics and their notes
- Available from any page
Automated reports
Regular digests in Telegram: daily, weekly or on your own schedule.
- Schedule and recipients
- Key KPIs and changes
Roles & access
Admin and viewer roles, with page-level access for each user.
- admin / viewer
- Page-level access
Export
CSV for every table with your filters applied, plus PDF and image export of pages and charts.
- CSV for every table
- Page PDF
Guided tour
A step-by-step walkthrough for new users — no training calls needed.
- 11 steps
- Replay anytime
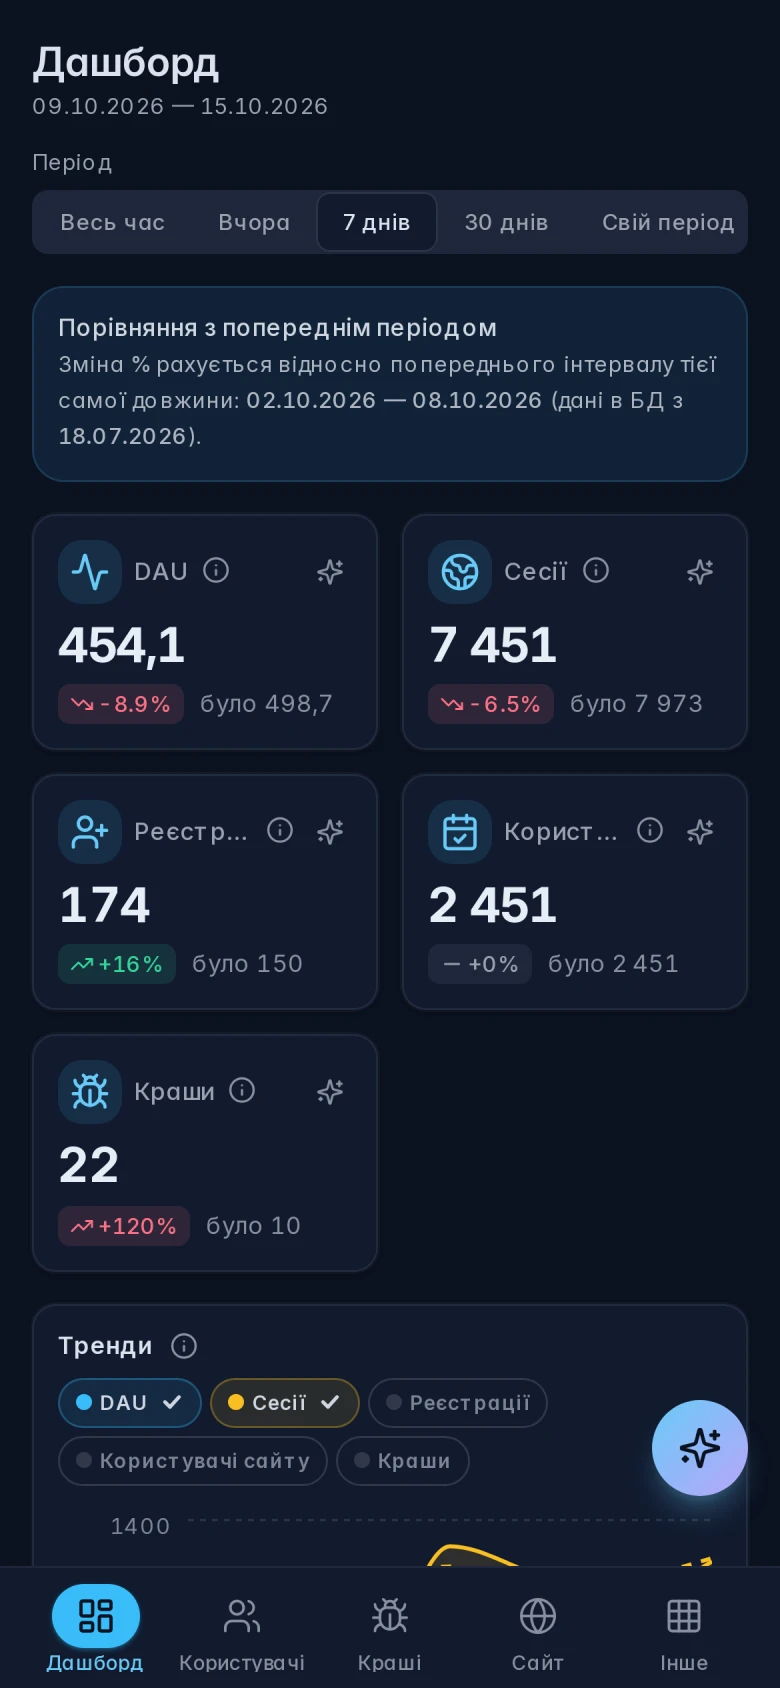
Works on phones too: bottom navigation, stacked cards and horizontally scrolling tables.
Product
Six designs, light and dark
The same data, in the style that suits your team. Need your own? I can build a unique style matching your product and brand: colours, fonts, shapes and logo.

Data sources
I’ll connect your data wherever it lives.
These aren’t one-click connectors — this is the service: I set up the extraction pipelines (ETL), refresh schedules and data checks. Every source is connected individually for your project.
Per project
Your databases
- PostgreSQL
- MySQL
- MS SQL
- ClickHouse
- MongoDB
Data warehouses
- BigQuery
- Snowflake
- Redshift
Web & product analytics
- Google Analytics 4
- Search Console
- Amplitude
- Mixpanel
- AppMetrica
Mobile attribution
- AppsFlyer
- Firebase / Crashlytics
- Adjust
Advertising
- Google Ads
- Meta Ads
- TikTok Ads
- LinkedIn Ads
CRM & sales
- HubSpot
- Pipedrive
- KeyCRM
- Bitrix24
- Salesforce
E-commerce
- Shopify
- WooCommerce
- Prom.ua
- Rozetka
Payments
- Stripe
- LiqPay
- monobank еквайринг
Spreadsheets & files
- Google Sheets
- Excel / CSV
APIs & webhooks
- REST API
- Webhooks
Product
Technology & security
- Your server or the cloud
- Deployed on your infrastructure with Docker Compose, or in the cloud (Railway). Your data stays with you.
- Read-only access
- I connect to sources with minimal permissions. Integration keys are stored on the server only.
- Sign-in and roles
- Password, TOTP (Google Authenticator), Google/Microsoft, magic link, SSO; optionally Cloudflare Access or VPN / IP allowlist. Admin / viewer roles.
- Modern stack
- Next.js and React on the front end, FastAPI and PostgreSQL on the back end, BigQuery for large volumes.
- 01SourcesCRM, ads, GA4, databases
- 02Pipelinescheduled ETL
- 03WarehouseBigQuery / PostgreSQL
- 04Modelone source of truth
- 05Dashboard & reportsworkspace, Telegram
Security & access
Protection that matches your security policy.
The public demo is open to everyone. On your project I enable what you need: from password + TOTP to Cloudflare Zero Trust or a VPN.
Login and password
Workspace accounts, JWT sessions, HttpOnly cookies.
Password + TOTP
Mandatory Google Authenticator or a backup code.
Google / Microsoft
OAuth for teams on Workspace or Microsoft 365.
Magic link
One-time email link, no password.
Company SSO
SAML / OIDC: Okta, Azure AD, Keycloak.
Cloudflare Access
Zero Trust: One-time PIN, SSO or device posture.
VPN / IP allowlist
Only from the office network or via corporate VPN.
Roles and audit
Admin / viewer, per-page access, sign-in and action log.
Admin / viewer roles and page-level access ship with every option.
Comparison
Your own web workspace or a BI tool?
Honestly: BI tools are great if you have an analyst who builds reports. Your own workspace wins when the people using the dashboard are owners and teams, not analysts.
No per-user licences
- Own workspace
- yes
- Power BI
- no
- Looker Studio
- yes
- Tableau
- no
- Metabase
- partly
You pay for the work and hosting; viewer count does not change the price.
Pro / Premium Per User — a licence for everyone who views reports.
Free to view; only third-party connectors cost money.
Creator / Explorer / Viewer — a paid seat per user.
Open source is free; Cloud and Pro are billed per user.
Your brand, domain and design
- Own workspace
- yes
- Power BI
- partly
- Looker Studio
- no
- Tableau
- partly
- Metabase
- partly
Your domain, logo, colours and fonts — fully on-brand.
Report themes exist; own domain and UI only via Embedded.
Reports live on lookerstudio.google.com with Google UI.
Limited branding; own portal via Embedded / Server.
White-label and own domain in paid plans or self-hosted.
AI assistant on your data
- Own workspace
- yes
- Power BI
- partly
- Looker Studio
- partly
- Tableau
- partly
- Metabase
- partly
The assistant answers questions about your own metrics and changes.
Copilot — on higher Fabric / Premium capacities.
Gemini features are arriving, mostly in Looker (Pro).
Tableau Pulse / Agent — on higher tiers.
Metabot exists but needs setup and a paid plan.
Telegram reports
- Own workspace
- yes
- Power BI
- no
- Looker Studio
- no
- Tableau
- no
- Metabase
- partly
Scheduled digests and alerts in Telegram — built in.
Email and Teams subscriptions; Telegram only via Power Automate.
PDF delivery by email; no messengers.
Email and Slack subscriptions; Telegram only via integrations.
Email and Slack; Telegram via webhooks and extra work.
You own the data and code (self-hosting)
- Own workspace
- yes
- Power BI
- partly
- Looker Studio
- no
- Tableau
- partly
- Metabase
- yes
Code and database deploy on your server (Docker) or cloud.
Report Server exists, but it is mostly Microsoft cloud.
Google cloud only, no access to the code.
Tableau Server can be self-hosted, but is licensed.
Open source — fully self-hostable.
Self-service ad-hoc exploration
- Own workspace
- partly
- Power BI
- yes
- Looker Studio
- yes
- Tableau
- yes
- Metabase
- yes
Filters, sorting and export yes; free-form drag & drop no.
Full self-service data exploration.
Drag-and-drop report builder for anyone.
The strongest tool for free-form analysis.
No-code question builder and SQL editor.
When your own workspace is better
Non-technical people use the dashboard, brand and explanations matter, you don’t want to pay per viewer, and you need Telegram reports and data on your own server.
When BI is the better fit
You have an in-house analyst, need free-form drag-and-drop exploration, and everyone already lives in Microsoft 365 or Google Workspace.
BI capabilities depend on the plan and change over time; this table is a general picture as of 2026.
Full comparisonRead more on the blog
See the workspace in action.
The demo opens with sample data — click around freely. Or message me and I’ll walk you through it using your business as the example.
Or reach me directly:
Open the demo →