GA4 BigQuery export: a practical guide for business owners
Why you should turn on the GA4 BigQuery export today, how the events_ tables and nested event_params work, what it costs, and the first SQL queries worth running.
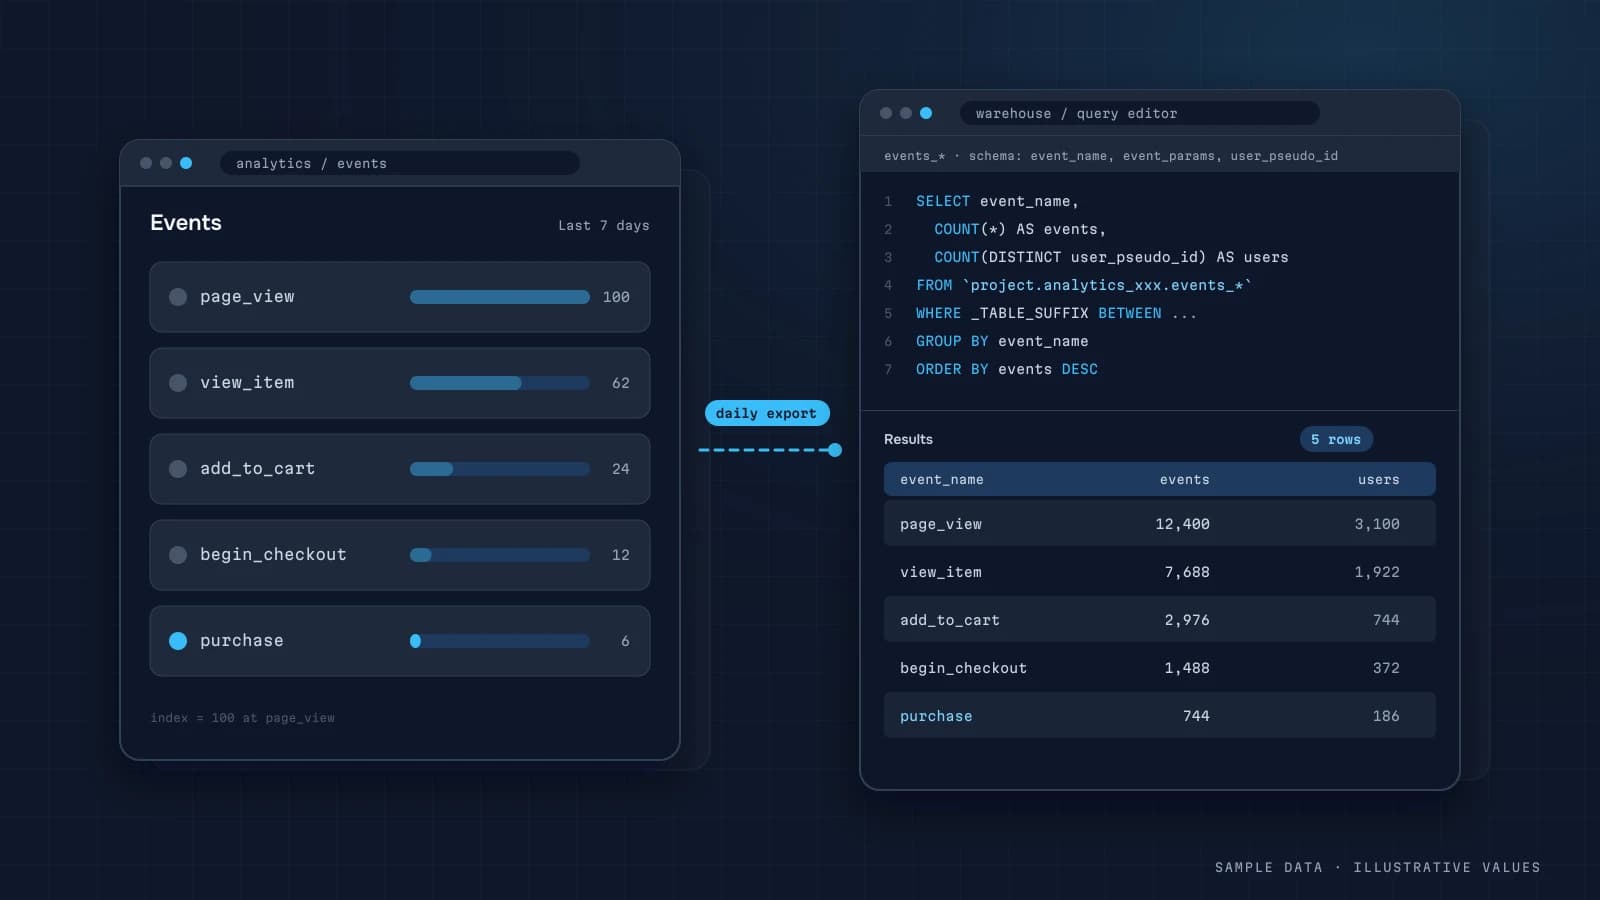
The GA4 interface is fine for simple questions: users, traffic sources, top pages. It stops being enough the moment someone asks "how much revenue came from customers who first arrived via Meta in March?" or "why doesn't GA4 revenue match Shopify?" Questions like that need raw events, and the free GA4 BigQuery export gives you exactly that.
This is how I set up the export on client projects, what you actually get, what it costs, and the queries I run first.
What the export actually is
The export is a native integration. Every day (or continuously, if you choose streaming), GA4 writes each event from your site or app into BigQuery, Google Cloud's data warehouse. You get events, not aggregated reports: page_view, view_item, add_to_cart, purchase, each with its parameters, traffic source, device and geo.
Why this matters:
- No sampling, no thresholds. Some GA4 reports apply thresholds and sampling. The raw tables have neither.
- You own the history. GA4 keeps data in Explorations for a limited time. BigQuery tables stay for as long as you keep them.
- You can join it with other data. CRM, ad spend, Stripe payouts, inventory.
- You write SQL instead of clicking. Any metric definition and any cohort you want.
One catch: the export only starts from the day you enable it. It never backfills. Turn it on now, even if analysis is months away.
How the tables are laid out
According to Google's documentation, GA4 creates a dataset named analytics_<property_id> with two kinds of tables:
| Table | When it appears | Use it for |
|---|---|---|
events_YYYYMMDD | daily export, once the day is processed | your stable reporting table |
events_intraday_YYYYMMDD | streaming export, during the day | near-real-time data; deleted when the daily table is complete |
The docs mention two details that catch people out:
- GA4 can keep updating a daily table for a few days after its date, because late events arrive via the Measurement Protocol or the mobile SDKs. Your pipeline should reprocess the last three days every run, not just yesterday.
- Table dates follow the GA4 property's time zone. Changing the time zone can cause discrepancies or a skipped day.
Why everything is nested
Each row is one event. Its parameters don't get their own columns. They sit in a repeated event_params field, an array of key/value pairs. Products work the same way through items. The export schema also includes device, geo, traffic_source, collected_traffic_source, ecommerce, user_pseudo_id and user_id.
You get at parameters with UNNEST:
SELECT
  event_date,
  (SELECT value.string_value FROM UNNEST(event_params) WHERE key = 'page_location') AS page,
  COUNT(*) AS views
FROM `project.analytics_123456789.events_*`
WHERE _TABLE_SUFFIX BETWEEN '20261001' AND '20261007'
  AND event_name = 'page_view'
GROUP BY 1, 2
ORDER BY views DESC;
_TABLE_SUFFIX limits which daily tables BigQuery scans. It's your main cost lever.
Setting it up, step by step
- Create a Google Cloud project and attach billing. The free sandbox has limits and doesn't support streaming export.
- Enable the BigQuery API.
- In GA4, go to Admin → Product links → BigQuery links → Link, then pick the project and the data location. You can't change the location later, so choose EU or US deliberately, keeping GDPR in mind.
- Pick a frequency. Daily is right for almost everyone. Only add streaming if you genuinely need same-day data.
- Optionally exclude noisy technical events so you don't pay to store them.
- Check the next day that yesterday's
events_table exists.
Tip: give a service account read-only access to the dataset right away. Dashboards and ETL jobs should connect with it, never with someone's personal Google login.
What it costs
The export itself is free. You pay BigQuery for storage and for bytes processed by queries. Prices and free tiers depend on region and do change, so check Google's BigQuery pricing page for current numbers.
On small and mid-size sites, the bill usually comes from careless queries, not storage. Habits that keep costs flat:
- Always filter on
_TABLE_SUFFIX, not onevent_date. - Never
SELECT *over raw events. - Build small aggregate tables (sessions, orders, daily KPIs) once a day, and point dashboards at those.
- Set a maximum-bytes-billed limit per query and turn on budget alerts in Cloud Billing.
The first queries to run
Google has a set of basic queries. These are the ones I open every audit with.
Daily revenue and orders
SELECT
  PARSE_DATE('%Y%m%d', event_date) AS day,
  COUNT(DISTINCT ecommerce.transaction_id) AS orders,
  SUM(ecommerce.purchase_revenue) AS revenue
FROM `project.analytics_123456789.events_*`
WHERE _TABLE_SUFFIX BETWEEN FORMAT_DATE('%Y%m%d', DATE_SUB(CURRENT_DATE(), INTERVAL 30 DAY))
                        AND FORMAT_DATE('%Y%m%d', CURRENT_DATE())
  AND event_name = 'purchase'
GROUP BY day
ORDER BY day;
If orders is far below what your store backend shows, BigQuery isn't broken. Your tracking has gaps. See why GA4 revenue doesn't match your CRM.
Duplicate transactions
SELECT ecommerce.transaction_id, COUNT(*) AS n
FROM `project.analytics_123456789.events_*`
WHERE _TABLE_SUFFIX >= '20261001' AND event_name = 'purchase'
GROUP BY 1
HAVING n > 1
ORDER BY n DESC;
The classic cause is a thank-you page that fires purchase again every time it's reloaded.
First-touch source
The traffic_source record holds the source that first acquired the user, not the source of the current session. Everyone trips on this at least once. For session sources, use collected_traffic_source or event parameters. Google explains the scopes here.
SELECT traffic_source.source, traffic_source.medium,
       COUNT(DISTINCT user_pseudo_id) AS new_users
FROM `project.analytics_123456789.events_*`
WHERE _TABLE_SUFFIX BETWEEN '20261001' AND '20261031'
  AND event_name = 'first_visit'
GROUP BY 1, 2
ORDER BY new_users DESC;From raw events to a dashboard
Raw events are the foundation. They aren't a report yet. The layering I use:
| Layer | Contents | Who reads it |
|---|---|---|
| Raw | events_* untouched | ETL only |
| Clean | sessions, de-duplicated orders, normalised UTMs | the analyst |
| Marts | daily KPIs, cohorts, channel performance with spend | dashboard, Telegram reports, AI assistant |
The marts rebuild overnight, and the dashboard queries small tables, so it loads in seconds. For combining this with your CRM and ad platforms, read data pipelines for small businesses. For a worked example of a mart, see cohort retention analysis.
Common mistakes
- Planning to enable the export "later" and losing a whole season of history.
- Connecting Looker Studio straight to
events_*, so every page view of the report scans gigabytes. - Counting users by
user_id, which only exists for logged-in visitors. - Treating
traffic_sourceas the session source. - Forgetting that the last few days are still being updated.
- Ignoring consent mode, then wondering why events are missing. See consent mode and your analytics.
Launch checklist
- Google Cloud project with billing and a budget alert
- Dataset location chosen deliberately (EU/US)
- Daily export on; streaming only if justified
- Read-only service account for tools
- Ecommerce events verified:
transaction_id,value,currency,items - Nightly mart build that reprocesses the last 3 days
- Dashboards read marts, not raw events
Rebuilding sessions and traffic sources in SQL
The export has no "sessions" table. A session is identified by the pair user_pseudo_id + the ga_session_id event parameter. The query below builds one row per session with its landing page and source. It's a starting point you'll adapt, not a drop-in replacement for the GA4 interface.
WITH ev AS (
  SELECT
    user_pseudo_id,
    (SELECT value.int_value FROM UNNEST(event_params) WHERE key = 'ga_session_id') AS session_id,
    TIMESTAMP_MICROS(event_timestamp) AS ts,
    event_name,
    (SELECT value.string_value FROM UNNEST(event_params) WHERE key = 'page_location') AS page,
    collected_traffic_source.manual_source  AS src,
    collected_traffic_source.manual_medium  AS med,
    collected_traffic_source.gclid          AS gclid
  FROM `project.analytics_123456.events_*`
  WHERE _TABLE_SUFFIX BETWEEN '20260901' AND '20260930'
)
SELECT
  user_pseudo_id, session_id,
  MIN(ts) AS session_start,
  ARRAY_AGG(page IGNORE NULLS ORDER BY ts LIMIT 1)[SAFE_OFFSET(0)] AS landing_page,
  ARRAY_AGG(src  IGNORE NULLS ORDER BY ts LIMIT 1)[SAFE_OFFSET(0)] AS source,
  ARRAY_AGG(med  IGNORE NULLS ORDER BY ts LIMIT 1)[SAFE_OFFSET(0)] AS medium,
  LOGICAL_OR(gclid IS NOT NULL) AS has_gclid,
  COUNTIF(event_name = 'purchase') AS purchases
FROM ev
GROUP BY 1, 2;
Notes from real projects:
- Don't use the top-level
traffic_sourcefor sessions. That record describes the user's first acquisition, not the current session. Use the event-levelcollected_traffic_sourcefields (or, in newer exports, the session-level last-click fields Google has added). Check your own schema, because the export keeps evolving. - Sessions with a
gclidbut no source are Google Ads traffic with auto-tagging. Map them togoogle / cpcyourself. - Your numbers will differ from the GA4 interface by a few percent. The interface applies modelling, thresholds and its own attribution. For decisions, consistency matters more than matching the UI exactly.
Keeping costs predictable
BigQuery charges on-demand queries by the bytes they scan (see Google's pricing page for current rates and the free tier). The export tables are wide, so careless queries can scan far more than they need. Habits that keep the bill small:
| Habit | Why |
|---|---|
Always filter _TABLE_SUFFIX | scans only the days you need |
| Select only the columns you use | SELECT * on the export reads every nested field |
| Build a daily aggregate table once | dashboards read a few MB instead of the raw export |
| Use the query validator's estimate before running | it shows the bytes the query will process |
| Set a custom daily query quota | a hard ceiling against runaway queries |
A sample cost estimate (illustrative)
Suppose a store generates around 50,000 events a day and each raw event row averages about 1 KB in the columns you actually query. A month is roughly 1.5 million rows, about 1.5 GB. Rebuilding a daily summary from yesterday's table each morning scans about 50 MB, which is negligible. A dashboard that queried the raw month directly on every filter change would scan 1.5 GB each time, and with a team clicking around all day that adds up fast. The aggregate table is what makes the difference, not the size of your traffic.
Scheduling the daily build
The simplest reliable setup is a BigQuery scheduled query that runs after the daily export lands (the daily tables usually appear during the following day, so don't schedule at 00:05):
-- runs daily, writes into analytics_mart.daily_sessions (partitioned by day)
DECLARE d STRING DEFAULT FORMAT_DATE('%Y%m%d', DATE_SUB(CURRENT_DATE(), INTERVAL 1 DAY));

DELETE FROM analytics_mart.daily_sessions WHERE day = PARSE_DATE('%Y%m%d', d);

INSERT INTO analytics_mart.daily_sessions
SELECT PARSE_DATE('%Y%m%d', event_date) AS day,
       COALESCE(collected_traffic_source.manual_source, '(direct)') AS source,
       COUNT(DISTINCT CONCAT(user_pseudo_id, CAST((SELECT value.int_value FROM UNNEST(event_params) WHERE key='ga_session_id') AS STRING))) AS sessions,
       COUNTIF(event_name = 'purchase') AS purchases
FROM `project.analytics_123456.events_*`
WHERE _TABLE_SUFFIX = d
GROUP BY 1, 2;
Delete-then-insert for one day makes the job safe to re-run: if yesterday's export arrived late or was re-processed, you just run it again. Add a check afterwards that the day has rows. An empty day should alert someone, not sit quietly in the dashboard.
Joining GA4 with your backend
The real value of the export shows up when you join it with orders from the CRM or shop database. Use transaction_id from the purchase event's ecommerce record:
| GA4 export gives you | Backend gives you | Joined, you get |
|---|---|---|
| source/medium, landing page, device | real paid amount, refunds, margin | margin by channel and landing page |
| user_pseudo_id across sessions | customer ID and repeat orders | repeat rate by first-touch channel |
| funnel events | delivery status, returns | which traffic brings orders that get returned |
Make sure the website passes the same order ID to GA4 that the backend stores. It's the single most valuable line in the whole tracking setup. More on this in GA4 ecommerce tracking.
Daily, streaming and user tables: what to switch on
The export settings offer several options, and they behave differently:
| Option | What you get | When to use it |
|---|---|---|
| Daily | events_YYYYMMDD, one complete table per day | always; this is the base for reporting |
| Streaming | events_intraday_YYYYMMDD, updated through the day | only if someone really acts on same-day data |
| User data | pseudonymous and user-ID user tables | for audience and lifetime analysis |
Things worth knowing before you rely on it (check Google's export documentation for current limits, because they change):
- Standard properties have a daily event limit for the daily export. If a large site exceeds it, the daily export can be paused. Streaming has no such limit but is billed by BigQuery as streaming data.
- Intraday tables are replaced once the daily table for that day is complete, so never build a permanent history on intraday tables.
- The export only starts from the day you link it. There's no backfill of earlier history, so link BigQuery early, even if you don't plan to query it for months.
- Late hits can update the last few days. Rebuilding a rolling window of the last 3 days each morning, rather than only yesterday, keeps the aggregate honest.
In practice, for a small or mid-size business: daily export on from day one, streaming off unless there's a concrete same-day use case, and user tables on if you plan cohort or LTV work.
FAQ
Can I export historical GA4 data?
No. The export starts on the day you enable it. You can pull some past aggregates through the GA4 Data API, but those are report-level numbers, not raw events.
Does the free version of GA4 support the BigQuery export?
Yes. Standard GA4 properties can export too, with daily export limits. Google's BigQuery Export help page lists the current limits.
Do I need an engineer to use BigQuery?
Not to switch it on. That's a few clicks. Useful reporting does need SQL and a good grasp of the schema. Usually an analyst builds the marts once, and from then on the team uses a finished dashboard.
Why do BigQuery numbers differ from the GA4 UI?
The raw data has no sampling, no thresholds and no modelling of missing data, and attribution is something you compute yourself. Small differences are normal, as long as you know where they come from.
How fresh is the data?
The daily table lands the next day and can still be updated for a few more days. Streaming gives you intraday data, but Google treats it as best-effort.

DATUMPANEL — Business data analytics
DATUMPANEL is an independent data analyst based in Ukraine. I build dashboards for business owners, set up GA4 and the BigQuery export, and run data pipelines and Telegram auto-reports for e-commerce, service businesses, SaaS and agencies, from data audit to decisions.