Cohort retention analysis: how to read the triangle and build it in SQL
What cohort analysis is, how to build retention and cumulative LTV cohorts for a store, a service business or an app, how to read the triangle, and the decisions it should drive.
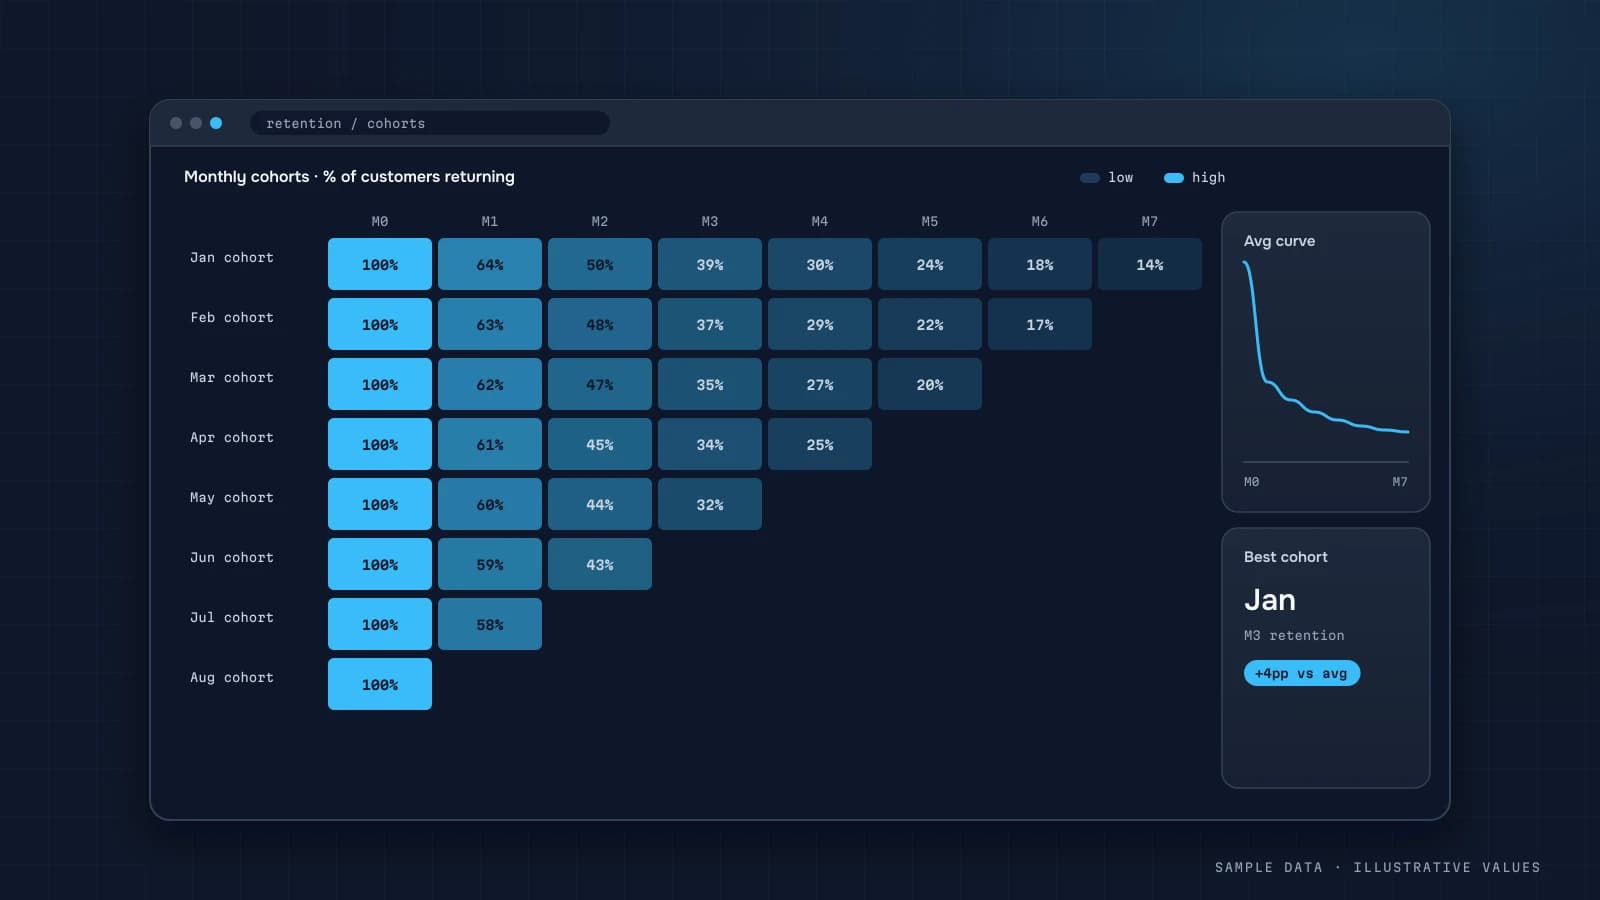
An average repeat purchase rate is a misleading metric. A big sale brings in a flood of first-time buyers, the average drops, and nothing is actually wrong with retention. Cohort analysis groups customers by their "birth date" and shows how each group behaves over time.
What a cohort is
A cohort is a group of customers who share the same starting event in the same period. The usual choices:
- first purchase month for a store;
- first visit month for a service business;
- install or signup week for an app or SaaS;
- subscription start month for SaaS.
The most valuable step is splitting cohorts further by first channel, first product or region.
What the cohort table looks like
Illustrative: the share of customers who made at least one purchase in month N after their first.
| Cohort | Customers | M0 | M1 | M2 | M3 | M4 | M5 |
|---|---|---|---|---|---|---|---|
| 2026-04 | 820 | 100% | 18% | 12% | 10% | 9% | 8% |
| 2026-05 | 910 | 100% | 17% | 12% | 9% | 9% | |
| 2026-06 | 1,340 | 100% | 11% | 7% | 6% | ||
| 2026-07 | 870 | 100% | 19% | 13% | |||
| 2026-08 | 900 | 100% | 20% |
How to read it
- Across a row: how one cohort retains over time.
- Down a column: whether newer cohorts retain better. M1 climbing from 17% to 20% is good news.
- Anomalies: the June cohort is larger and retains worse. That's typical of a sale or a deep discount that attracted deal hunters.
Types of cohort metrics
| Metric | Cell value | Use |
|---|---|---|
| Customer retention | % active in month N | loyalty |
| Revenue retention | cohort revenue in month N / M0 revenue | money from repeat buyers |
| Cumulative LTV | total margin per customer up to month N | CAC payback |
| Subscription retention | % of subscriptions still active | SaaS |
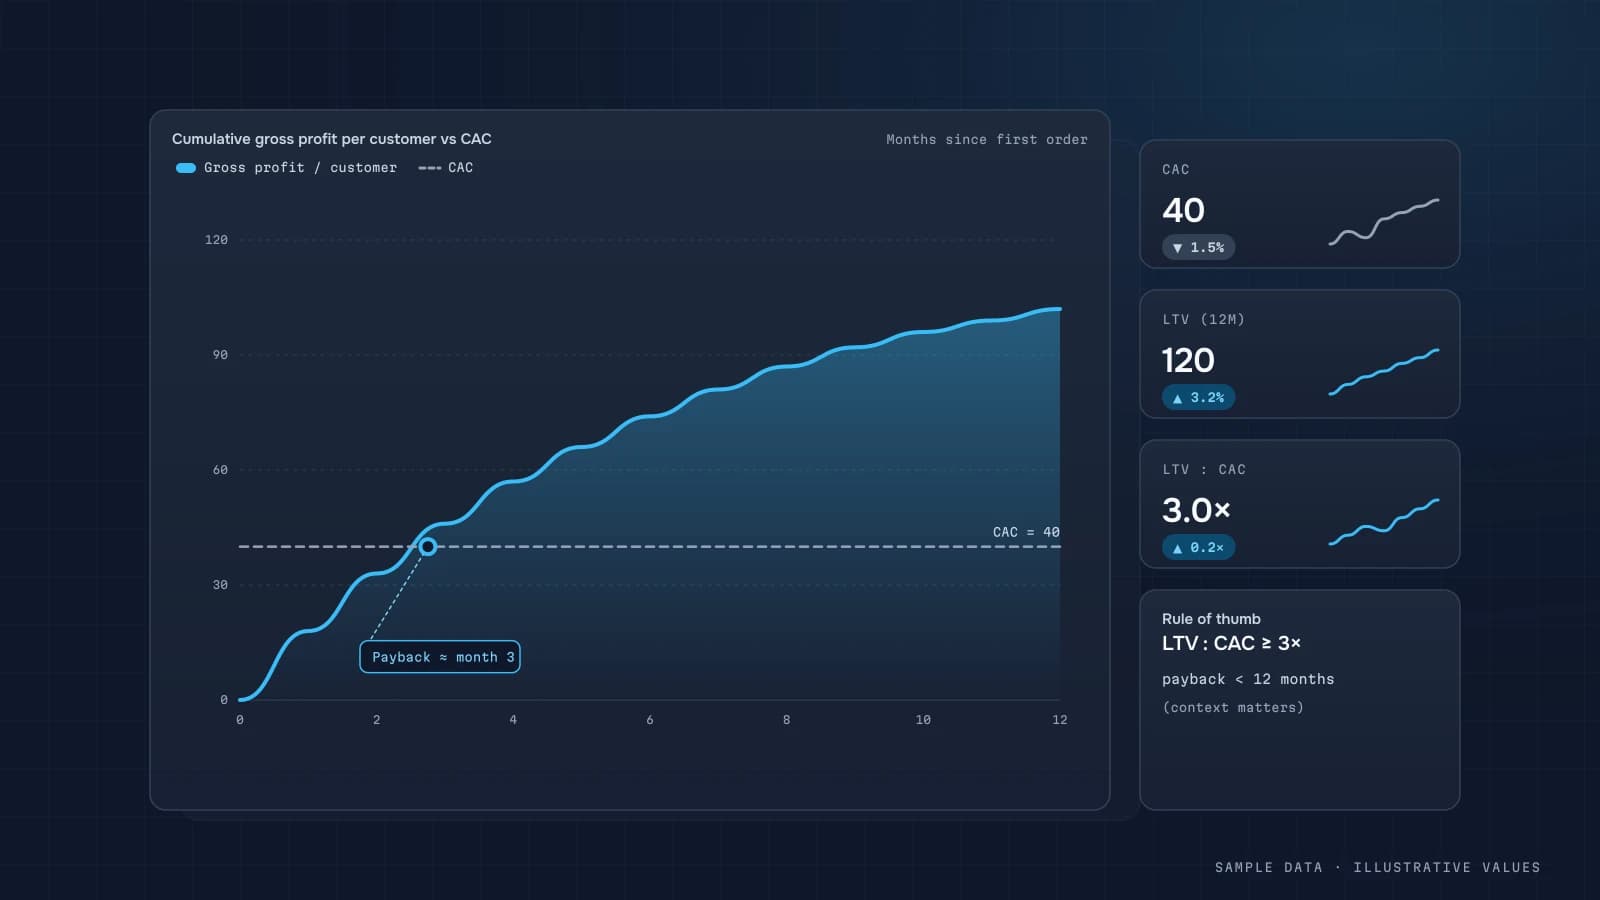
Cumulative LTV is the one founders find most useful. Put CAC next to it and you can see the month in which a cohort paid back (LTV to CAC).
SQL: retention cohorts
PostgreSQL, with a table orders(customer_id, order_date, status):
WITH first AS (
  SELECT customer_id, DATE_TRUNC('month', MIN(order_date)) AS cohort
  FROM orders WHERE status = 'paid'
  GROUP BY 1
),
activity AS (
  SELECT DISTINCT o.customer_id, f.cohort,
         (EXTRACT(YEAR FROM AGE(DATE_TRUNC('month', o.order_date), f.cohort)) * 12
        + EXTRACT(MONTH FROM AGE(DATE_TRUNC('month', o.order_date), f.cohort)))::int AS m
  FROM orders o JOIN first f USING (customer_id)
  WHERE o.status = 'paid'
)
SELECT cohort, m,
       COUNT(*) AS active,
       ROUND(100.0 * COUNT(*) / FIRST_VALUE(COUNT(*)) OVER (PARTITION BY cohort ORDER BY m), 1) AS pct
FROM activity
GROUP BY cohort, m
ORDER BY cohort, m;
In BigQuery, replace AGE with DATE_DIFF(order_month, cohort, MONTH).
Cohorts from GA4
For behavioural cohorts (returning to the site, not buying), use user_pseudo_id and first_visit from the GA4 BigQuery export. Remember that without a login, one person on two devices counts as two users. For money cohorts, use backend data.
Decisions cohorts should drive
- Channel quality. If TikTok cohorts retain worse than search cohorts, allow a lower CAC for TikTok.
- Promotion side effects. If sale-acquired customers buy less often, cap discount depth or change the offer.
- First experience. A steep M0→M1 drop points at the first order: shipping, quality or communication.
- Repeat timing. If most second orders land in month 2, that's when your reminder or personal offer should go out.
Showing cohorts on a dashboard
- a heatmap with a single colour scale;
- a metric switch: customers / revenue / cumulative LTV;
- filters for first channel and first product category;
- a CAC line on the cumulative LTV chart;
- the cohort size printed on each row, since small cohorts are noisy.
For the bigger customer-economics picture, see the unit economics guide. To segment customers you've retained, see RFM segmentation.
Common mistakes
- Using average retention with no cohorts.
- Comparing incomplete months with complete ones.
- Ignoring cohort size.
- Counting refunds as activity.
- Building revenue cohorts on GA4's
user_pseudo_id.
Checklist
- Starting event and cohort period are defined
- Customers are identified consistently (email / customer ID)
- Only paid orders count
- Three modes: customers, revenue, cumulative LTV
- First-channel filter
- The current incomplete period is flagged
Worked example: reading a real-looking triangle
An illustrative monthly retention table for a store (share of each cohort placing another order in month N):
| Cohort | Customers | M1 | M2 | M3 | M4 | M5 |
|---|---|---|---|---|---|---|
| May | 820 | 14% | 9% | 8% | 7% | 6% |
| June | 900 | 13% | 9% | 7% | 7% | |
| July | 1,450 | 8% | 5% | 4% | ||
| August | 880 | 15% | 10% | |||
| September | 910 | 16% |
How to read it:
- Rows show how one cohort behaves over time. May's retention flattens at around 6–7% from M3, so those are the loyal customers.
- Columns compare cohorts at the same age. July's M1 is half the others'.
- The July outlier has 60% more customers but much lower retention. That's the signature of a big promo or a broad acquisition campaign that brought in one-time bargain hunters. Count it in CAC decisions: the cost per retained customer from that campaign was far higher than its CAC suggested.
- August and September look better than May at the same age, so something improved. Check what changed (a post-purchase email flow, a new product line, better targeting) and keep it.
Cumulative revenue per customer: the LTV view
Retention tells you whether customers return. Cumulative revenue per customer tells you what they're worth. Same illustrative store:
| Cohort | M0 | M1 | M2 | M3 | M6 |
|---|---|---|---|---|---|
| May | 1,050 | 1,210 | 1,320 | 1,420 | 1,690 |
| July | 980 | 1,060 | 1,110 | 1,150 | — |
If May customers reach about 1,690 of revenue in six months and contribution margin is around 30%, each is worth roughly 507 of margin in that period. That's your upper bound for CAC on similar acquisition, before you've taken any profit. July customers, at 1,150 after 3 months and flattening, justify a much lower CAC. These numbers go straight into CAC and LTV decisions.
SQL: cumulative revenue per customer by cohort
WITH first AS (
  SELECT customer_id, DATE_TRUNC(MIN(order_date), MONTH) AS cohort
  FROM clean.orders WHERE status = 'paid' GROUP BY 1
),
rev AS (
  SELECT f.cohort,
         DATE_DIFF(DATE_TRUNC(o.order_date, MONTH), f.cohort, MONTH) AS m,
         SUM(o.revenue_net) AS revenue
  FROM clean.orders o JOIN first f USING (customer_id)
  WHERE o.status = 'paid'
  GROUP BY 1, 2
),
size AS (SELECT cohort, COUNT(*) AS customers FROM first GROUP BY 1)
SELECT r.cohort, r.m, s.customers,
       SUM(r.revenue) OVER (PARTITION BY r.cohort ORDER BY r.m) / s.customers AS cum_revenue_per_customer
FROM rev r JOIN size s USING (cohort)
ORDER BY r.cohort, r.m;
Two cautions. Don't show cells for months that haven't finished yet: the current month always looks like a drop. And a cohort smaller than about a hundred customers gives percentages that swing on a handful of people, so merge small months into quarters.
Cohorts by acquisition channel
The most useful cut is usually cohort × first-order channel. Illustrative 90-day repeat rates:
| First-order channel | Customers | Repeat within 90 days |
|---|---|---|
| Organic search | 1,100 | 22% |
| Email/referral | 300 | 28% |
| Paid social | 1,600 | 11% |
| Marketplace | 900 | 6% |
If paid social brings 40% of new customers but they return half as often, the "cheap CAC" from that channel is less cheap than it looks. Marketplace customers often belong to the marketplace, not to you, and that's worth knowing before you invest in growing it.
Weekly or monthly cohorts?
Pick the cohort period by how often customers buy:
| Business | Purchase cycle | Cohort period | Read retention at |
|---|---|---|---|
| Food delivery, groceries | days | weekly | W1, W4, W8 |
| Fashion, cosmetics | weeks to months | monthly | M1, M3, M6 |
| Furniture, electronics | months to years | quarterly | Q1, Q2, Q4 |
| SaaS, subscriptions | billing cycle | monthly | M1, M3, M12 |
| Services (salons, studios, repair) | visit cycle | monthly | M1, M2, M3 |
Too fine a period gives noisy, sparse tables. Too coarse a period hides the effect of the campaigns and changes you want to evaluate. When in doubt, start monthly and change if the table looks mostly empty or mostly the same.
FAQ
How much data do I need?
Six-plus months of history and cohorts of a few hundred customers give a useful picture. With less data, use quarterly cohorts.
What's a normal retention rate?
Compare against your own history and across channels, not against someone else's benchmark. Retention depends heavily on category and purchase frequency.
How do I identify guest customers?
By normalised email from the order. Shopify and most platforms already group guest orders by email.
Can I build cohorts in Google Sheets?
Yes, with pivot tables on small volumes. With thousands of orders and weekly refreshes, move the calculation to SQL.

DATUMPANEL — Business data analytics
DATUMPANEL is an independent data analyst based in Ukraine. I build dashboards for business owners, set up GA4 and the BigQuery export, and run data pipelines and Telegram auto-reports for e-commerce, service businesses, SaaS and agencies, from data audit to decisions.