Service business analytics: bookings, utilisation and no-shows
The metrics salons, studios, schools, repair shops and local services need (bookings, schedule utilisation, no-shows, cost per booking, revenue per staff member, repeat visits) and how to pull them from booking tools, your CRM and ads.
In a service business (salon, studio, school, repair shop, coworking space, home services) the main resource isn't stock on a shelf. It's staff time. An empty hour in the schedule is gone for good. So analytics revolves around bookings, utilisation and returning clients rather than carts.
Core metrics
| KPI | Formula | Why |
|---|---|---|
| Bookings | new bookings in period | demand |
| Utilisation | booked hours / available hours | resource use |
| No-show rate | no-shows / bookings | lost money |
| Late cancellations | cancellations < 24h / bookings | planning |
| Average visit value | revenue / visits | pricing and upsell |
| Revenue per staff member | revenue / staff (or per hour worked) | team efficiency |
| Repeat visit rate | clients with 2+ visits in 90 days / clients | loyalty |
| Visit interval | average days between visits | return rhythm |
| Cost per booking | ad spend / new ad-sourced bookings | marketing efficiency |
| Inquiry-to-booking rate | bookings / inquiries (calls, forms, chats) | lead handling |
Utilisation is the headline number
Utilisation shows how much money the business leaves on the table. Break it down:
- by staff member: some are booked a week out, others sit idle;
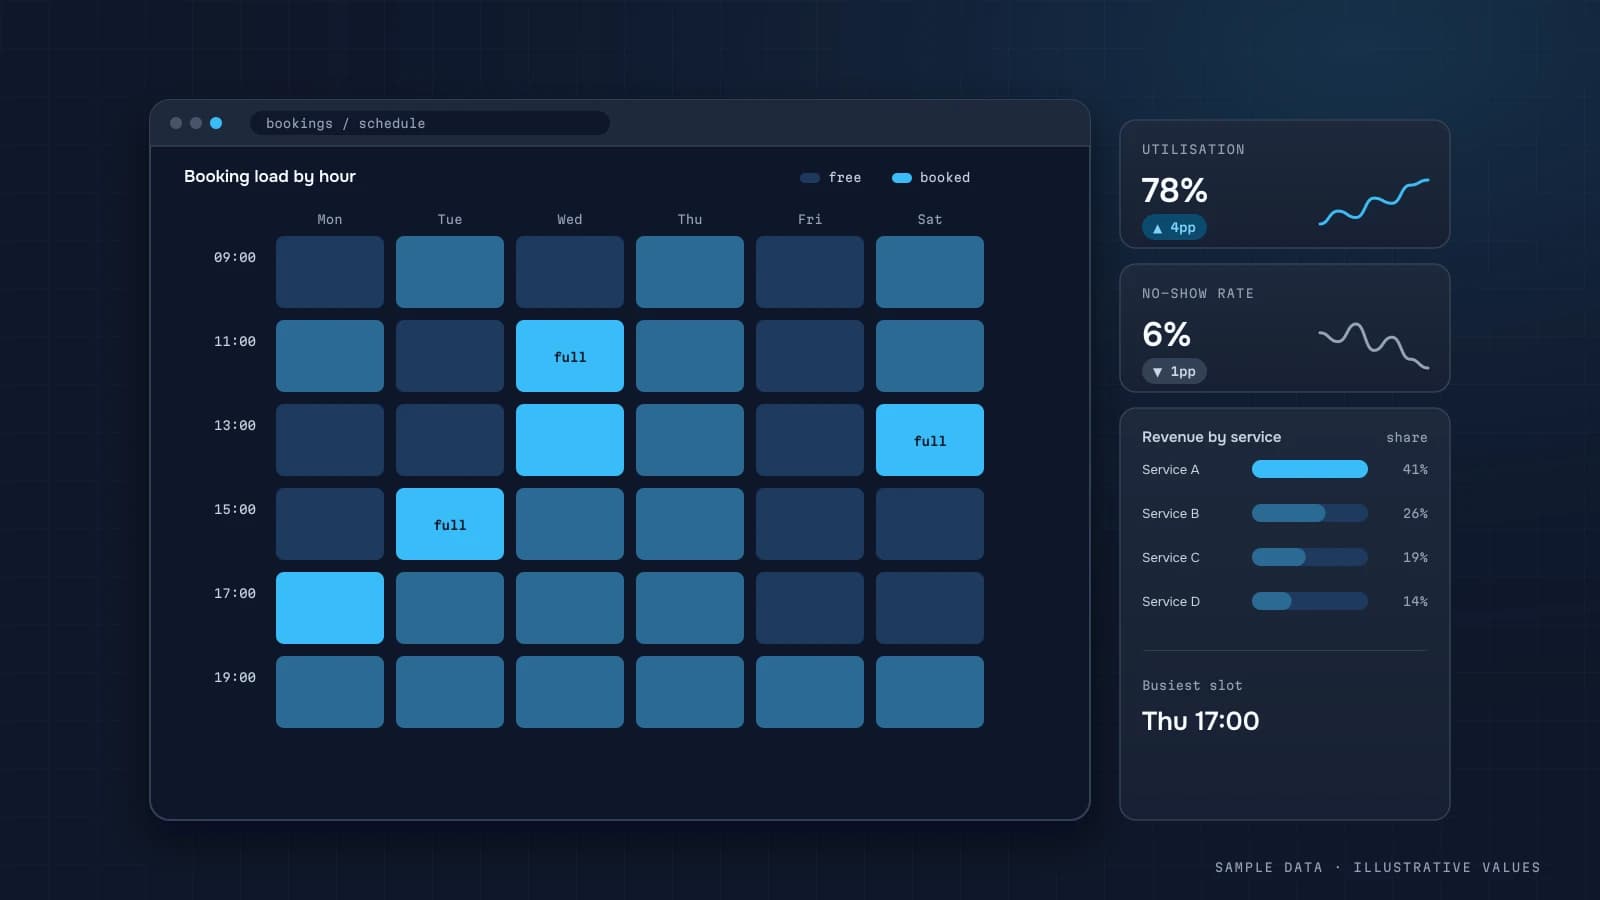
- by weekday and hour: an hourly heatmap suggests offers like "weekday mornings";
- by service: long, expensive services fill a day differently from short ones.
If utilisation stays high, the bottleneck isn't marketing. It's headcount or pricing.
No-shows and cancellations
A no-show is a direct loss: the staff member is paid or idle, and the slot is unsold. A dashboard helps you see:
- the no-show rate by acquisition channel (new ad-sourced clients often no-show more);
- the effect of reminders, comparing no-shows before and after SMS or messenger reminders;
- repeat no-show clients, who should be asked for a deposit.
Data sources
| Data | Source |
|---|---|
| Bookings, visits, statuses, staff | booking platform (Fresha, Square Appointments, Mindbody, etc.) or CRM |
| Payments | POS, Stripe, Square |
| Inquiries | site forms, call tracking, messengers |
| Website behaviour | GA4 |
| Ads | Google Ads, Meta, TikTok |
| Reviews | Google Business Profile and others |
The hard part is connecting ads to bookings. Booking often happens in a third-party widget GA4 can't see. The fixes: pass UTMs into the widget if it supports them, track "Book now" clicks as an event, and store the source on the client record. See the UTM convention.
The service funnel
| Step | Metric |
|---|---|
| Site / profile visit | sessions, views |
| Inquiry (form, call, chat, widget) | inquiries |
| Booking | bookings, inquiry-to-booking rate |
| Visit | visits, no-shows |
| Return visit | repeats in 90 days |
The biggest leak is often between inquiry and booking: missed calls, chat replies three hours later. Response time to inquiries is a useful metric on its own.
A first-screen example
- bookings this week, vs last week;
- utilisation (overall, plus the hourly heatmap);
- no-show rate;
- revenue and average visit value;
- cost per booking from ads;
- 90-day repeat visit rate.
See the service business page for an example. A daily digest with tomorrow's bookings and open slots is very useful for front-desk staff (automated reports).
Common mistakes
- Watching revenue only, so empty hours go unnoticed.
- Mixing new and returning clients in cost per booking.
- Ignoring inquiries from calls and messengers.
- Not recording cancellation reasons.
- Not storing the client's source in the CRM.
Checklist
- Staff availability is maintained in the system
- Visit statuses: attended / no-show / cancelled
- Client source is stored in the CRM
- "Book now" clicks are tracked in GA4
- Utilisation by staff member and by hour
- No-shows by channel
- Repeat visits and visit interval
Worked example: utilisation and revenue per available hour
An illustrative salon with 4 specialists, open 10 hours a day, 26 working days a month:
| Specialist | Available hours | Booked hours | Utilisation | Revenue | Revenue per available hour |
|---|---|---|---|---|---|
| Specialist 1 | 240 | 204 | 85% | 122,400 | 510 |
| Specialist 2 | 240 | 168 | 70% | 92,400 | 385 |
| Specialist 3 | 200 | 170 | 85% | 76,500 | 383 |
| Specialist 4 | 240 | 132 | 55% | 66,000 | 275 |
| Total | 920 | 674 | 73% | 357,300 | 388 |
Revenue per available hour combines price and utilisation into one number you can compare across people, locations and months. Here, specialist 3 is as busy as specialist 1 but earns less per hour, so it's a pricing or service-mix question. Specialist 4 has free capacity, so the question is demand or scheduling.
Lifting total utilisation from 73% to 80% at the same average price per booked hour (about 530) adds roughly 0.07 × 920 × 530 ≈ 34,000 a month, without a single new chair. That's usually the cheapest growth available to a service business.
SQL: utilisation from a booking system
WITH slots AS (            -- available hours per specialist per day, from schedules
  SELECT staff_id, day, SUM(TIMESTAMP_DIFF(shift_end, shift_start, MINUTE)) / 60 AS available_h
  FROM clean.staff_shifts GROUP BY 1, 2
),
booked AS (
  SELECT staff_id, DATE(start_at) AS day,
         SUM(TIMESTAMP_DIFF(end_at, start_at, MINUTE)) / 60 AS booked_h,
         SUM(IF(status = 'no_show', 1, 0)) AS no_shows,
         COUNT(*) AS bookings,
         SUM(IF(status = 'completed', price, 0)) AS revenue
  FROM clean.bookings
  WHERE status IN ('completed', 'no_show')     -- cancelled in advance frees the slot
  GROUP BY 1, 2
)
SELECT s.staff_id, DATE_TRUNC(s.day, MONTH) AS month,
       SUM(s.available_h) AS available_h,
       SUM(b.booked_h) AS booked_h,
       SAFE_DIVIDE(SUM(b.booked_h), SUM(s.available_h)) AS utilisation,
       SAFE_DIVIDE(SUM(b.no_shows), SUM(b.bookings)) AS no_show_rate,
       SAFE_DIVIDE(SUM(b.revenue), SUM(s.available_h)) AS revenue_per_available_h
FROM slots s LEFT JOIN booked b USING (staff_id, day)
GROUP BY 1, 2;
Count no-shows as booked time (the slot was lost) but not as revenue. Late cancellations can be treated the same way. Write the rule in your definitions.
Rebooking rate: the retention metric for services
For services with a natural cycle (haircuts, physiotherapy courses, cleaning), the strongest early signal of retention is whether the client books the next visit before leaving or within a few days:
Rebooking rate = visits followed by a new booking within N days / completed visits
Choose N from your service cycle, for example 7 days for "booked at the counter or right after". Track it per specialist and per service. It moves weeks before revenue does, and it responds directly to front-desk scripts and reminder messages.
Weekly review for a service business
- Utilisation by specialist and day of week (where are the empty hours?)
- No-show rate and the effect of reminders
- Rebooking rate by specialist
- New clients by source, and their second-visit rate (cohorts)
- Revenue per available hour vs last month
Where the data comes from
Most online booking systems offer an API or a regular export of bookings, schedules and payments. If there's no API, a daily CSV export to a cloud folder, loaded automatically into the warehouse, is a perfectly workable start. The key requirement is that staff schedules make it into the data too. Without available hours, you can't compute utilisation.
Reducing no-shows: measure each change
No-shows are one of the few problems you can test cheaply. Change one thing at a time and compare the no-show rate for 3–4 weeks before and after, or better, for randomly split clients:
| Change | What to measure |
|---|---|
| Reminder 24 h before (messenger or SMS) | no-show rate for reminded vs not reminded |
| Confirmation request ("reply 1 to confirm") | share confirmed, and no-shows among unconfirmed |
| Deposit for first-time clients or long services | no-shows and booking conversion (deposits can reduce bookings) |
| Waitlist for freed slots | share of cancelled slots refilled |
Track the effect on utilisation too, not only no-shows. A deposit that halves no-shows but loses a fifth of new bookings may not be a win.
FAQ
What utilisation level is good?
It depends on the format. Some services need slack for last-minute bookings. The trend, and the differences between staff and weekdays, tell you more.
How do I calculate cost per booking when many bookings come by phone?
Record the source when the booking is created (front desk asks "how did you hear about us?", or you use call tracking), then count bookings by that field.
Does a service business need GA4?
Yes, to see which pages and channels drive inquiries. Money and visits still come from the booking system.
Does this work for multi-location businesses?
Yes. Metrics are calculated per location and per staff member, so the owner sees the whole picture and the comparisons between locations.

DATUMPANEL — Business data analytics
DATUMPANEL is an independent data analyst based in Ukraine. I build dashboards for business owners, set up GA4 and the BigQuery export, and run data pipelines and Telegram auto-reports for e-commerce, service businesses, SaaS and agencies, from data audit to decisions.