Power BI vs Looker Studio vs Metabase (and Tableau): which to choose
A vendor-neutral comparison of Power BI, Looker Studio, Metabase and Tableau for small and mid-size companies, covering data sources, licensing model, speed and learning curve, and when you need none of them.
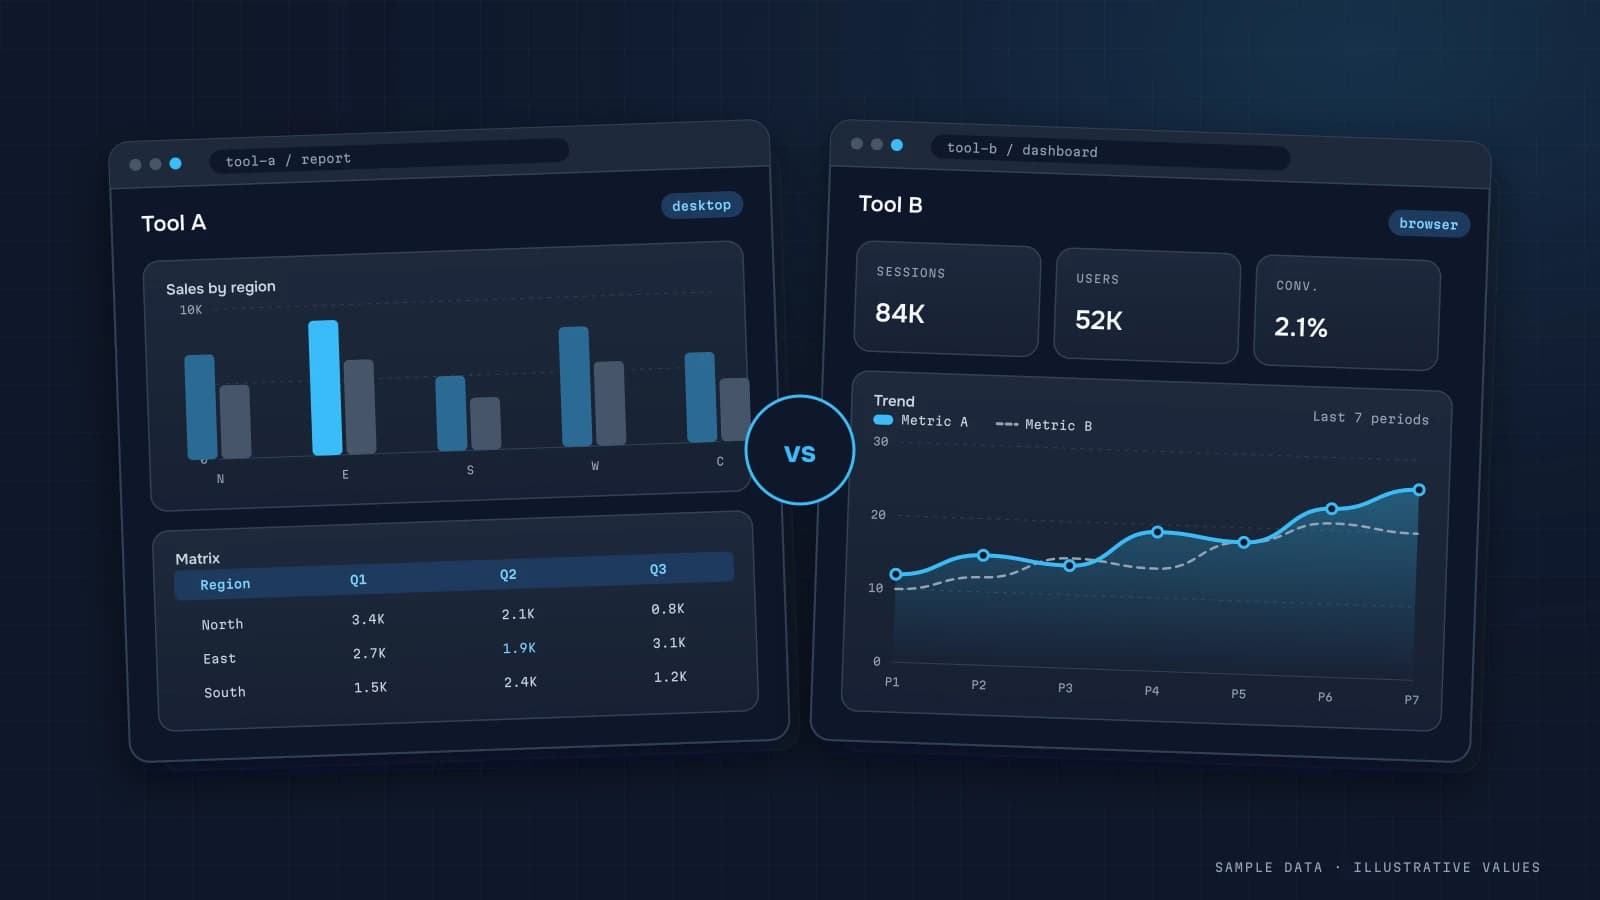
"Power BI or Looker Studio?" is one of the first questions clients ask me. The honest answer depends on where your data lives, who will read the reports and whether anyone on the team will actually maintain them. This is the comparison I use myself when choosing a tool for a client.
BI pricing changes every year, so there are no list prices here. Check each vendor's current pricing before you commit.
The short version of each
Looker Studio (Google, which has renamed the product more than once) is a free report builder. It's at its best with GA4, Google Ads, BigQuery and Google Sheets. A paid Pro tier adds team management.
Power BI (Microsoft) is a serious BI tool with a real data model and the DAX language. Desktop is free, but sharing reports usually requires a licence for every author and viewer.
Metabase is open-source BI. You can self-host it for free or use the cloud version. It's strong on SQL databases like PostgreSQL and MySQL.
Tableau (Salesforce) is the benchmark for visual analytics, and it's pricier and heavier than most small businesses need.
Comparison table
| Criterion | Looker Studio | Power BI | Metabase | Tableau |
|---|---|---|---|---|
| Learning curve | low | medium (DAX, Power Query) | low–medium | medium |
| Licensing | free; Pro per user | per author and viewer | open source, or flat + users | per user role |
| Best-fit sources | GA4, Ads, BigQuery, Sheets | Excel, SQL Server, Microsoft 365 | PostgreSQL, MySQL, warehouses | almost anything |
| Data modelling | weak (blending) | strong | medium (SQL, models) | strong |
| Self-hosting | no | partly (Report Server) | yes | yes (Server) |
| Speed on raw data | slow without prep | good with import | depends on the DB | good with extracts |
| Branding / embedding | limited | paid Embedded options | yes, more on paid tiers | yes |
| Chat (Slack/Telegram) reports | not built-in | via subscriptions/email | via webhooks | via subscriptions |
Looker Studio: when it fits
Good if:
- your data is mostly GA4, Google Ads, Search Console and Sheets;
- you need a marketing report quickly and for free;
- you have lots of viewers and don't want to pay per seat.
Where people hit walls:
- Speed. Connecting straight to GA4 or raw BigQuery is slow and runs into API quotas. Pre-aggregating fixes it (GA4 BigQuery export).
- Blending is weak. Build complex models in SQL instead.
- Connectors for Meta Ads, CRMs and the like are often paid third-party products.
Power BI: when it fits
Good if:
- the company runs on Microsoft 365 and Excel;
- someone is willing to learn DAX and Power Query;
- you need a proper model with many related tables and calculated measures.
Limits:
- Per-viewer licensing on the base tiers makes a report for 20 managers noticeably more expensive.
- Scheduled refreshes per day are capped by tier.
- Desktop is Windows-only. Mac users get the web version.
Metabase: when it fits
Good if:
- your data already sits in PostgreSQL/MySQL or a warehouse;
- you want no per-user licences, by self-hosting;
- the team is technical and comfortable with SQL.
The trade-off: it's plainer visually and has fewer built-in connectors to ad platforms, so you load the data into a database yourself.
Tableau: when it fits
For companies with analysts who need the most flexible visual analytics and have a licence budget. For most small businesses it's more than they need.
What actually decides it
In my experience, three things matter more than feature lists:
- Where the data is, and whether it's clean. No BI tool fixes broken tracking. Without a pipeline, every tool is equally slow and equally wrong (data pipelines).
- Who maintains it. A report without an owner decays within months, whatever the tool.
- Who reads it. An analyst wants drag-and-drop. A founder wants six KPIs with explanations and a summary in chat.
When you need none of them
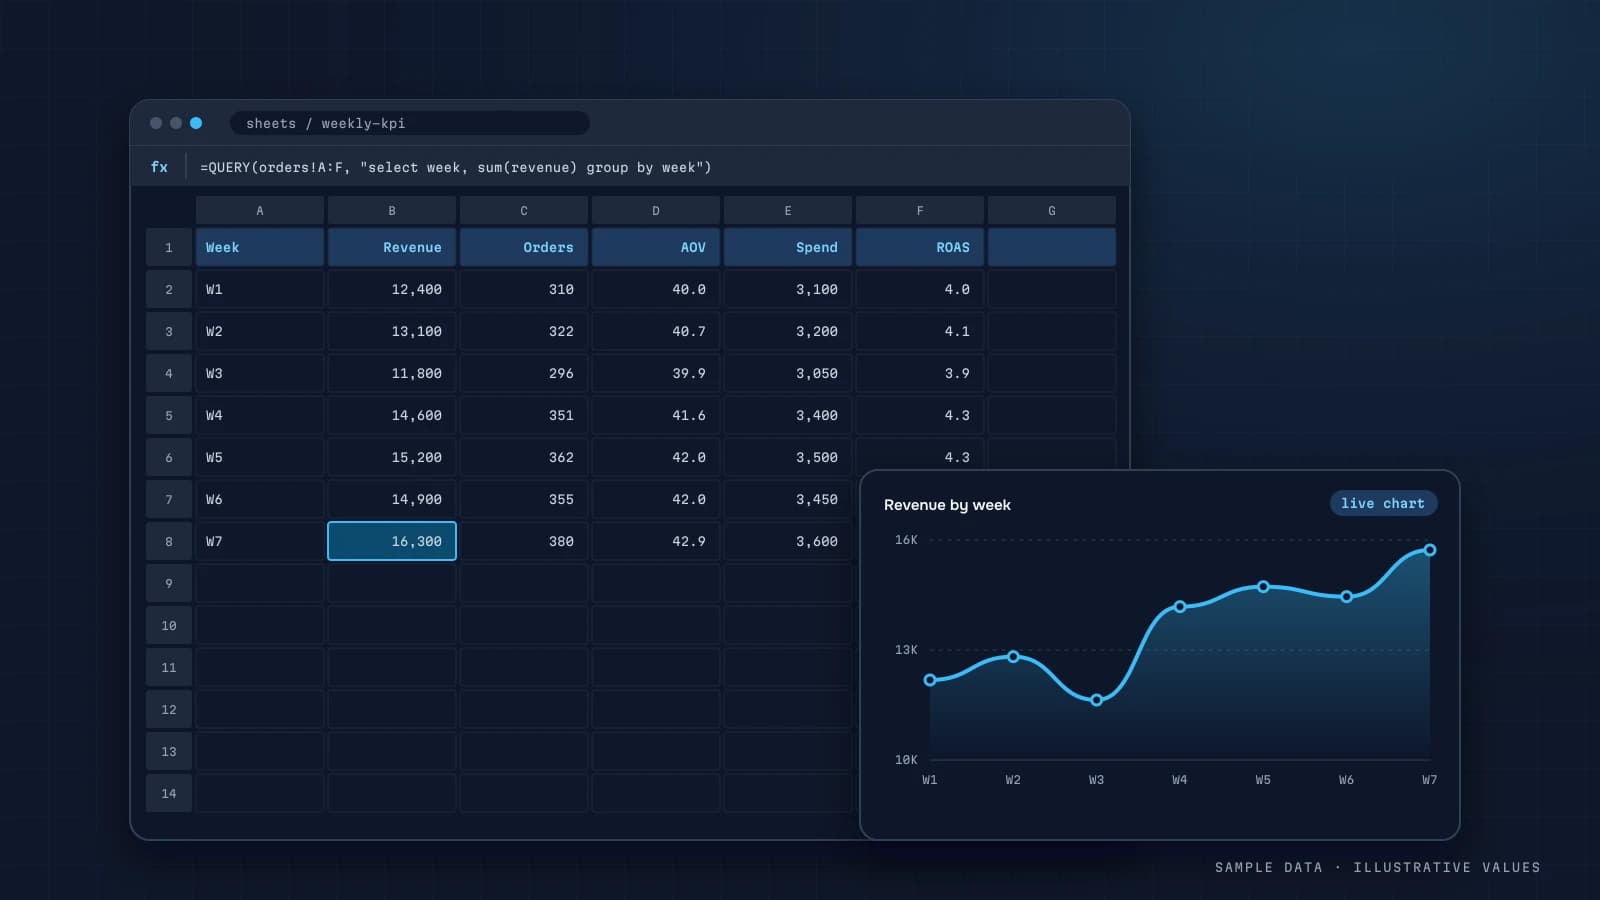
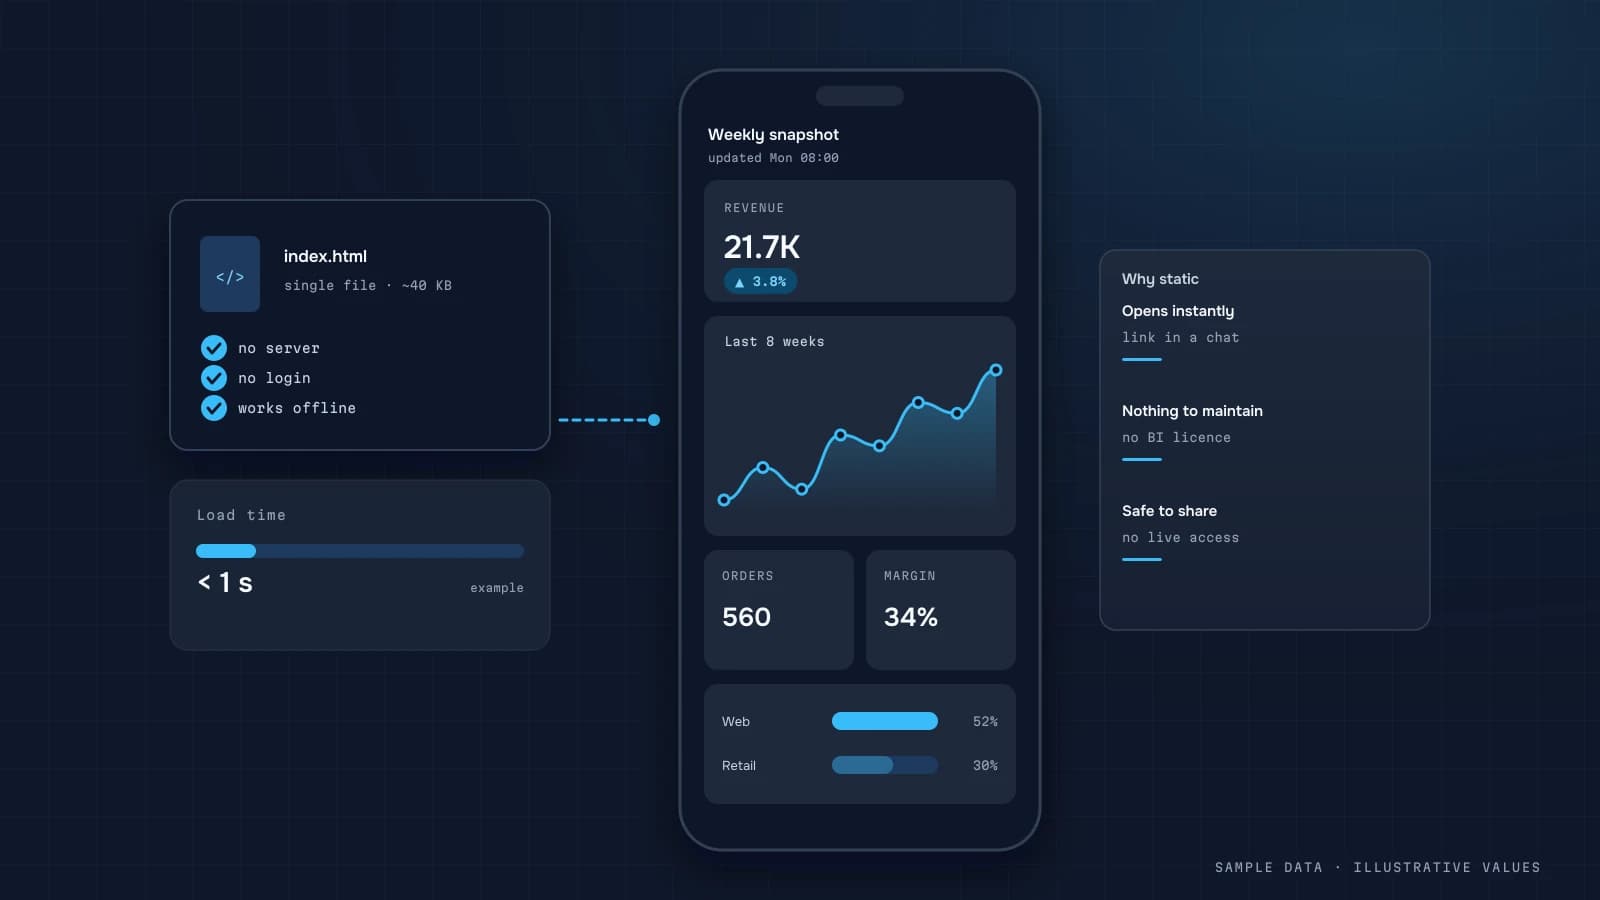
- A one-off report on finished tables: a static micro-dashboard on GitHub Pages or Vercel is enough.
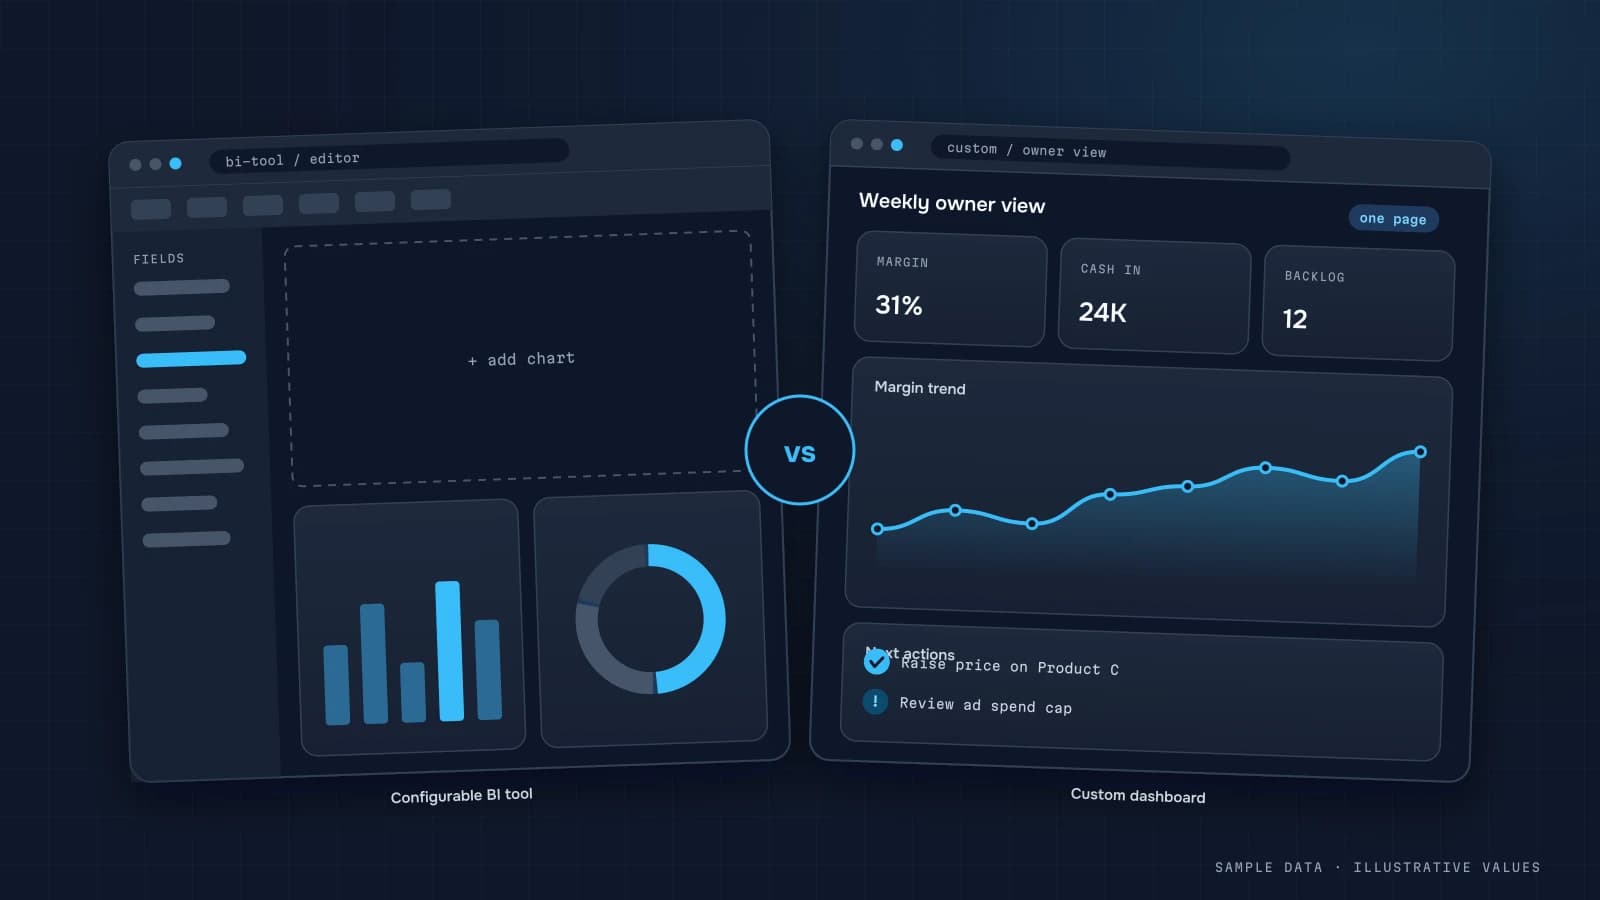
- A non-technical team that cares about branding, explanations, chat reports and data on its own server: a custom workspace is often simpler and cheaper long-term.
- Little data and one manager: Google Sheets may genuinely be enough.
Picking by scenario
| Situation | Recommendation |
|---|---|
| Marketing report from GA4 and Google Ads | Looker Studio + aggregate tables in BigQuery |
| Finance reporting, Excel culture | Power BI |
| Product analytics on PostgreSQL | Metabase |
| Founder wants 6 KPIs, explanations, chat reports | custom workspace |
| One-off investor report | static micro-dashboard |
See also how we compare a custom workspace with BI tools on the comparison page.
A worked scenario: the same dashboard built three ways
Take a typical brief: a store wants a weekly marketing and sales dashboard combining GA4, Google Ads, Meta Ads and orders from its shop database, for 5 people.
| Step | Looker Studio | Power BI | Metabase (self-hosted) |
|---|---|---|---|
| GA4 and Google Ads | native connectors | connectors exist; GA4 is easiest via BigQuery | via BigQuery or a warehouse |
| Meta Ads | third-party (usually paid) connector, or load into BigQuery first | third-party connector or warehouse | warehouse |
| Shop database | direct to PostgreSQL/MySQL, or via BigQuery | direct or via gateway | direct |
| Joining sources | data blending, limited and slow at scale | Power Query + data model, strong | SQL in the warehouse |
| Sharing with 5 people | free, Google accounts | each viewer typically needs a license unless capacity is bought | free (open source), your server |
| Who maintains it | marketer-friendly | analyst-friendly (DAX) | needs someone comfortable with SQL and a server |
The pattern I see over and over: once you combine more than two or three sources, the tool matters less than whether the data is already joined in a warehouse. With a clean BigQuery or PostgreSQL layer underneath, all three tools work. Without it, each has its own way of struggling. See the data pipeline guide.
Performance and refresh: the practical limits
Check current limits in each vendor's documentation, because they change. As a guide:
- Looker Studio queries the source live (with caching). Slow sources make slow dashboards, and blends over large data can time out. Pointing it at pre-aggregated tables fixes most of this.
- Power BI usually imports data into its own model and refreshes on a schedule. The number of scheduled refreshes per day depends on the license tier, so "real-time" needs DirectQuery or a higher tier.
- Metabase queries the database directly and caches results. Speed depends on your database and indexes.
- Tableau supports both live connections and extracts. It's powerful, but sized and priced for organisations with a dedicated BI role.
For an owner looking at yesterday's numbers every morning, a daily refresh is enough in every tool. Don't pay for real-time unless someone acts within the hour.
Total cost over a year (illustrative structure)
License prices change, so here is how to calculate rather than a number. Check the official pricing pages for Power BI, Metabase and Tableau.
Annual cost = licenses × viewers × 12 + connectors + hosting/warehouse + setup hours + maintenance hours × 12
| Line | Looker Studio | Power BI | Metabase OSS |
|---|---|---|---|
| Licenses | 0 (Pro tier optional) | per user per month | 0 |
| Connectors | often paid for non-Google sources | sometimes | 0 if data is in your DB |
| Hosting | 0 | 0 | a small server |
| Setup and upkeep | lowest for simple cases | moderate, needs DAX skills | moderate, needs SQL and server upkeep |
In most small-team projects, the hours (setup plus monthly maintenance) end up costing more than the licenses. Picking the tool your team can maintain without you is usually the cheapest option.
Migration: switching later without starting over
Teams often start in Looker Studio and outgrow it. To keep that switch cheap:
- Keep business logic in SQL views in the warehouse, not in tool-specific calculated fields
- Use the same metric names and definitions as your metric glossary
- Build each chart on one table or view, avoiding tool-side blends
- Document filters and date logic per dashboard
Done this way, rebuilding a dashboard in another tool takes days, not months, because only the visual layer moves.
Access, security and client sharing
Who sees what often decides the tool more than chart types do:
| Need | Looker Studio | Power BI | Metabase |
|---|---|---|---|
| Share with external clients | easy (Google accounts or link), so watch link-sharing settings | possible, but licensing for external viewers needs planning | users and groups on your instance, or embedding |
| Row-level security (each client sees only their rows) | workable via filters on viewer email, but limited | built in (RLS roles) | data sandboxing on paid tiers |
| Embedding in your own portal | embed via iframe | Power BI Embedded (a separate product) | embedding (signed embedding on paid tiers) |
| Audit of who viewed what | limited | available in the admin portal | available on paid tiers |
If you're an agency sending dashboards to clients, row-level access and embedding usually matter more than any visual feature. See agency client reporting.
Run a two-week trial before committing
Don't pick from comparison tables, this one included. Build one real screen in your top two candidates with your own data and answer:
- Can it connect to every source you need without a paid add-on, or is the add-on acceptable?
- How long does the main screen take to load with a full year of data?
- Can the person who will maintain it change a metric without help?
- Does sharing work the way your viewers need (internal, clients, mobile)?
- What does it cost at your viewer count in 12 months, not today?
- How hard would it be to leave? Where does the business logic live?
Two weeks of building one real screen tells you more than any feature list.
FAQ
Is Looker Studio really free?
The core product is. Third-party connectors (Meta Ads, for example) and the Pro tier cost money, and BigQuery queries are billed separately.
Can I move from Looker Studio to Power BI later?
Yes. If your data already lives in a warehouse, migrating means rebuilding the visuals, not the whole analytics stack. That's why I tell clients to invest in the data model first.
Why is Looker Studio so slow on GA4?
Every interaction triggers a call to the GA4 API, which has quotas. The fix is the BigQuery export plus prepared aggregate tables.
We have 30 viewers and one analyst. What should we use?
Something without per-viewer licences: Looker Studio, self-hosted Metabase or a custom workspace.

DATUMPANEL — Business data analytics
DATUMPANEL is an independent data analyst based in Ukraine. I build dashboards for business owners, set up GA4 and the BigQuery export, and run data pipelines and Telegram auto-reports for e-commerce, service businesses, SaaS and agencies, from data audit to decisions.